Volatile Volatility (PREMIUM-UNLOCKED)
The following post was originally issued to TLS members on February 7, 2018.
By any number of metrics, the stock volatility market just experienced its most spasmatic episode of all-time – what does it mean for traders and investors?
The stock market events of the past week certainly qualify as one of those memorable episodes in the annals of Wall Street, even for those of us with decades of time in the grind. And when it is all said and done, this particular set of circumstances will be remembered as a volatility event.
Yes, many observers are rightfully focused on the events surrounding volatility-based exchange traded products. Whether they were the genesis of the past week’s market action or merely added fuel to the fire, there is no doubt that they played a significant role. And as many folks have warned, this enigmatic slice of the trading world has now undergone the reckoning (or the start of it) that has seemed all along to be its inevitable fate. We’ll let others opine further on that subject, though.
The focus of this post is the extraordinary (and, of course, not unrelated) action in the spot volatility market and the associated metrics. These tools, e.g., the S&P 500 Volatility Index, or VIX, and other derivatives, can serve as valuable stock market indicators, especially as it pertains to sentiment. They are particularly helpful when registering extremes like they did yesterday. We’re going to take a look at 3 such examples of historic readings from the volatility market along with some historical reference points to see if we can gain an edge here given these readings.
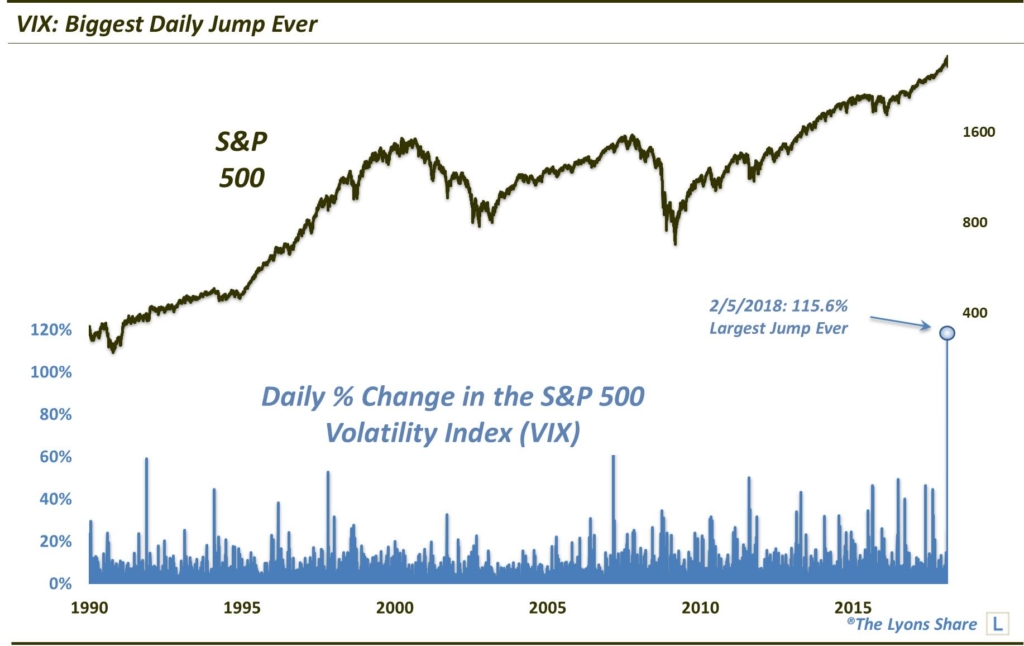
The first comes from the VIX itself which soared yesterday by more than 100%. That was the first time in the history of the current iteration of the VIX going back to the early 1990′s that it actually doubled in one day. In fact, there have been just 3 other instances of even 50% daily jumps. This was not your ordinary volatility spike.
What have we seen after outsized daily spikes like this? Of course, a jump this size is unprecedented. If we loosen the parameters to VIX jumps of at least 45%, we get 7 prior occurrences going back to 1993. The S&P 500 (SPX) has fared very well in the intermediate-term following such spikes.
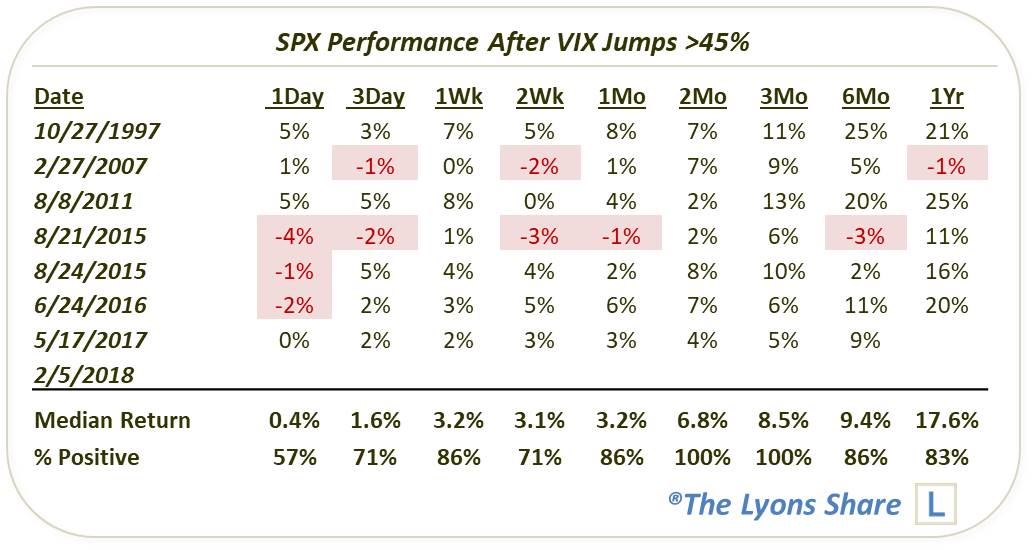
Yes, there is the possibility (and probability) of further volatility in the near-term. However, as the table indicates, gains (and healthy ones at that) have occurred almost unanimously following these VIX spikes.
What about the VIX itself? This table shows the performance of the VIX following those dates.
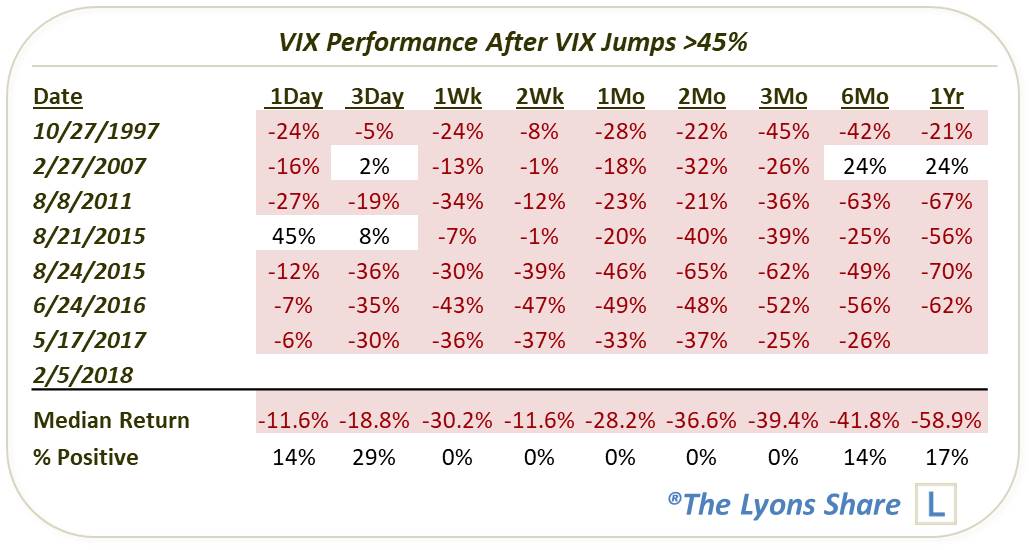
The VIX has obviously come down already from its Monday close. However, if history is any guide, there should be significant further pullback in the intermediate-term (FYI, we probably don’t have to say it after this week, but play the volatility market at your own risk).
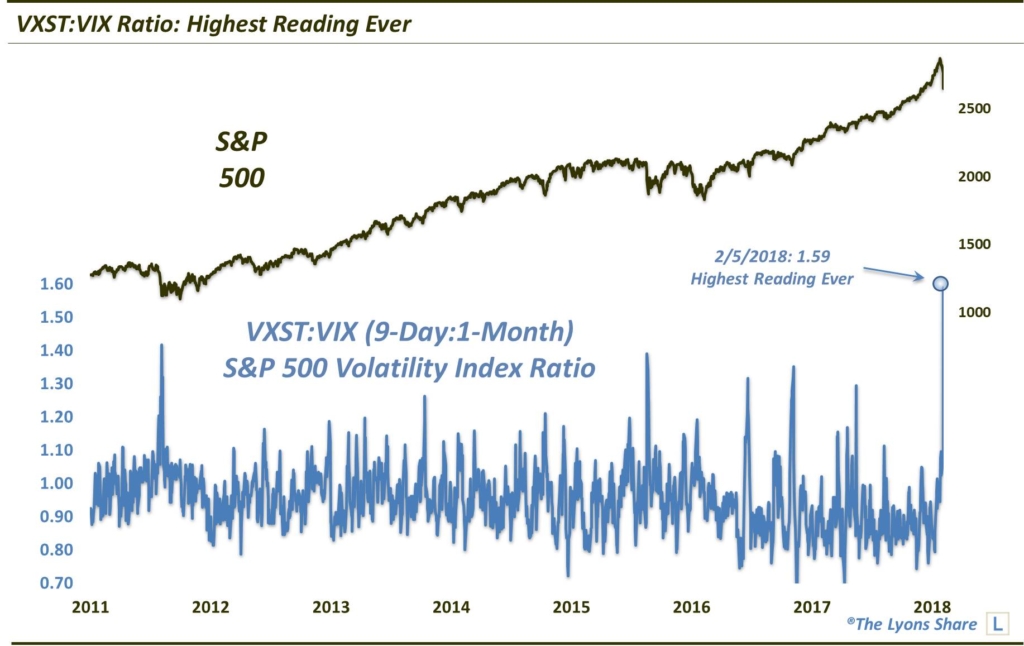
The 2nd example of yesterday’s historic day in the volatility market involves action in the term structure of the market. Specifically, we are looking at the relationship between the 9-Day S&P 500 Volatility Index, ”VXST”, and the 1-Month “VIX”. Typically, when traders get nervous, the will bid up the near-term vol instruments faster than the later-dated ones. And when the relationship gets extreme, i.e., when the closer index moves above the longer-dated one, it can be a sign of excessive fear, and a potential harbinger of an approaching stock market bottom.
You can say that yesterday’s vol term structure registered an extreme “fear” reading. That’s because, not only did the VXST:VIX ratio climb above 1.00 – it hit 1.59. That smashed the prior record high reading of 1.41, going back to the inception of the VXST in 2011. That is some fear right there.
Here is the performance of the SPX following the 11 times since the VXST inception that the VXST:VIX ratio has risen as high as 1.26.
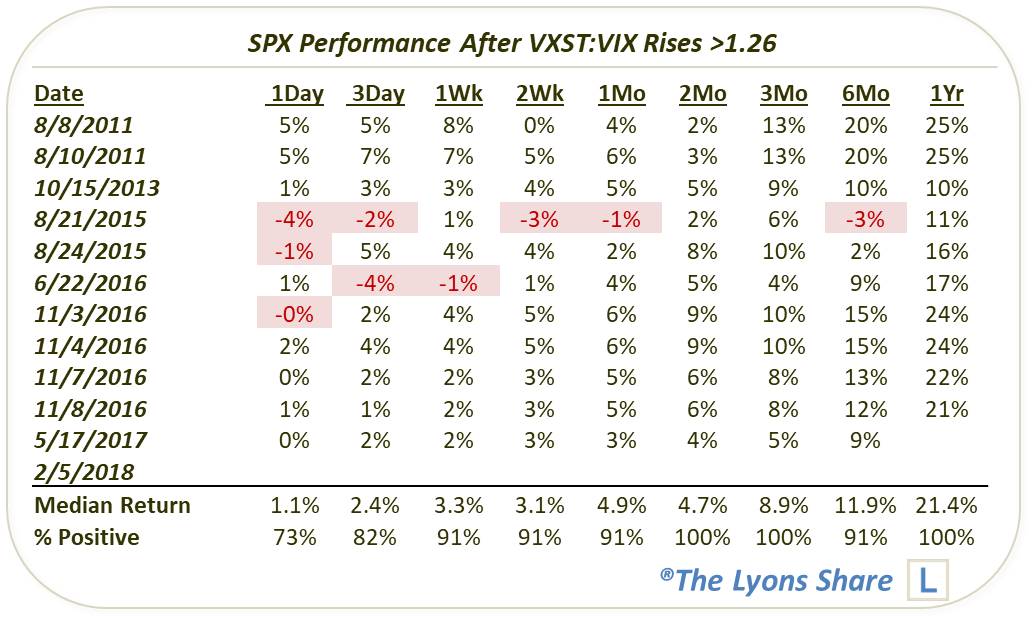
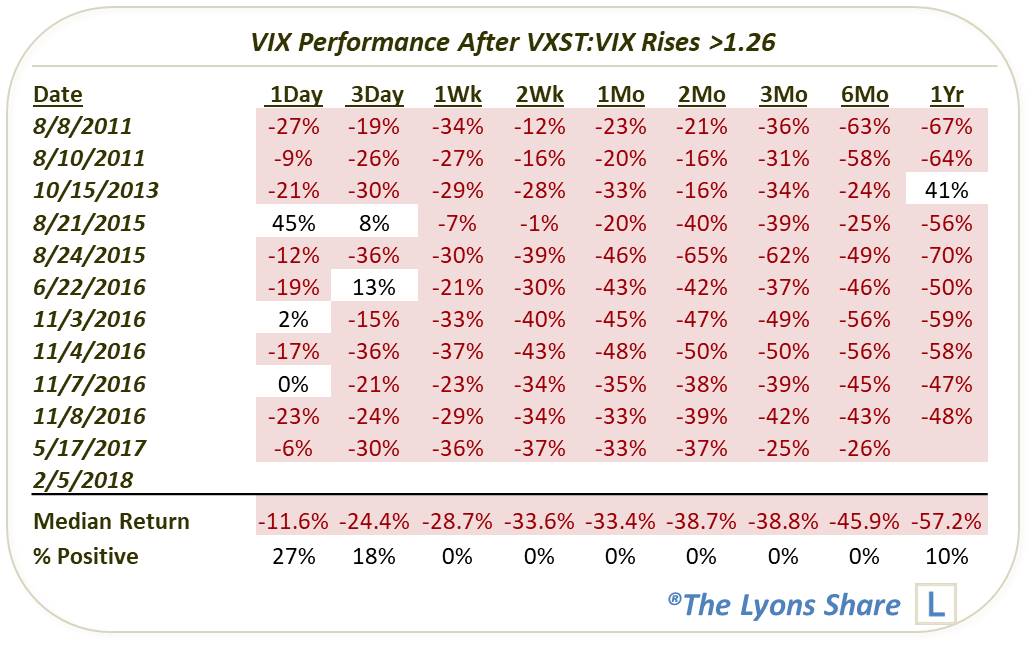
There are obviously a few dates that are clustered together. However, the forward performance of the SPX is compellingly positive with nearly unanimously good results from 1week to 1 year later. Again, while there may be volatility in the near-term, this historical study also suggests high odds of stock market gains in the intermediate-term. It also suggests overwhelmingly high odds of lower VIX readings in the intermediate-term.
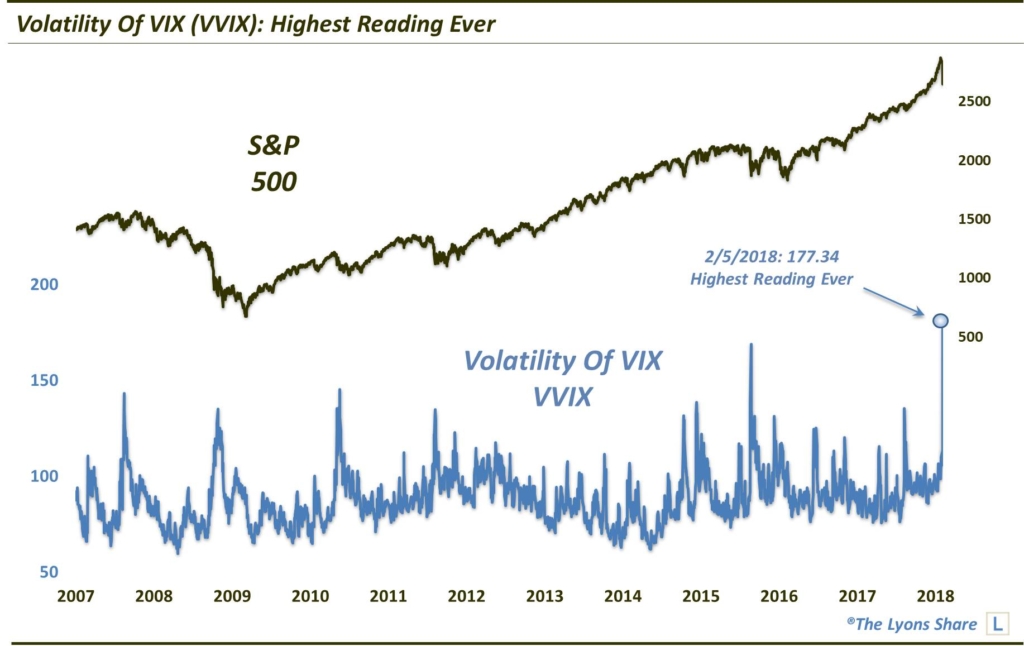
Lastly, since we are talking about volatility in the markets, and about the volatility market itself…let’s take a look at the volatility of volatility. Yes, even the VIX has its own Volatility Index, known as “VVIX”. As it implies, the VVIX measures volatility expectations on the VIX.
And judging by yesterday’s reading, volatility expectations for volatility have never been higher, as the VVIX came in at an unprecedented 177.34 reading.
Here is the performance of the SPX and the VIX after the VVIX reaches as high as 132.
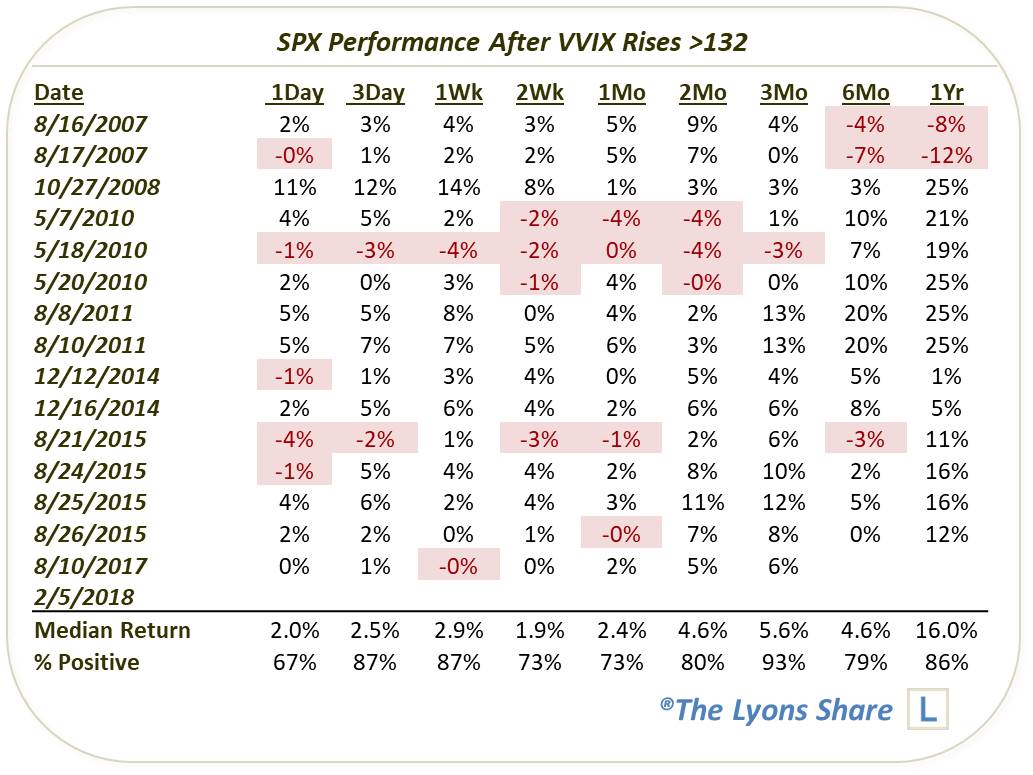
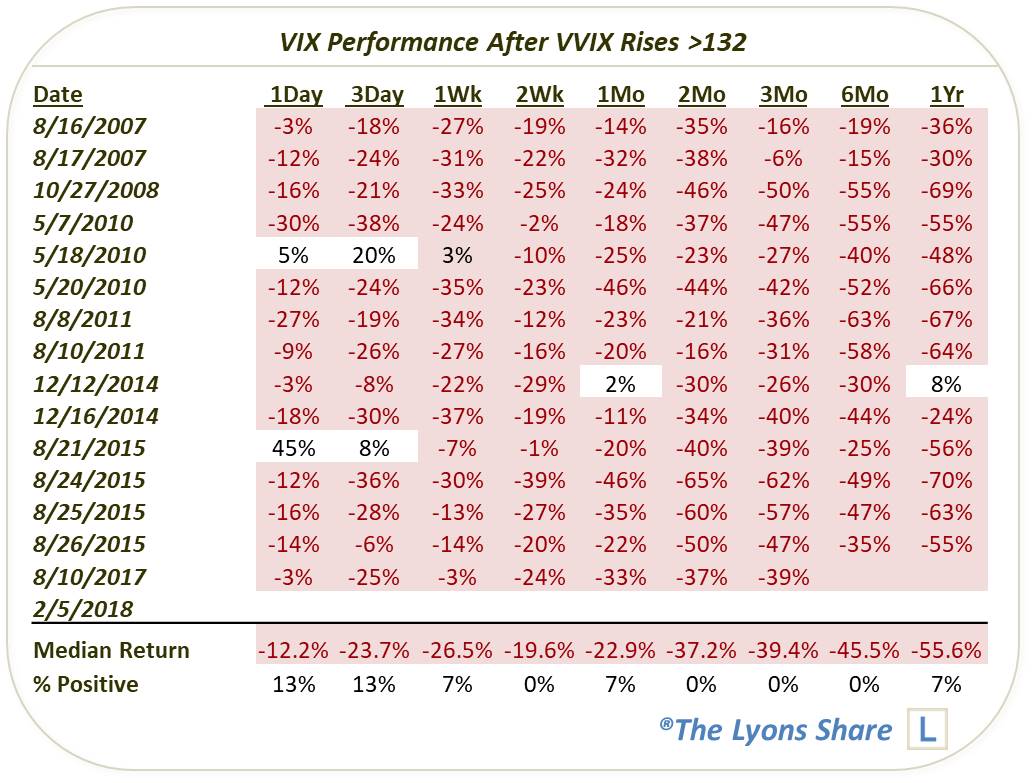
While perhaps slightly less impressive than the first 2 studies (probably due to the presence of the signals near the 2007 cyclical top), the results do again strongly suggest strong odds of further upside in stocks and downside in volatility in the intermediate-term.
So what’s the takeaway from this epic episode in volatility? As Warren Buffett once said, it is wise to be “greedy when others are fearful”. The historical stats displayed here would back up the assertions that 1) investors became fearful, 2) it is wise to be greedy when others are fearful, and 3) it is wise to be greedy now.
As we have emphasized in our DSS daily videos, risks of continued volatility in the near-trm are high. Additionally, we don’t know if the mechanics of the volatility ETP market are distorting the sentiment picture here. However, going by what we do know and can measure, odds of further intermediate-term gains in the stock market are high based on the recent, historic spike in volatility.
If you are interested in the Premium version of our charts and research, check out our “all-access” service, The Lyons Share. You can follow our investment process and posture every day — including insights into what we’re looking to buy and sell and when. Thanks for reading!
_____________
Disclaimer: JLFMI’s actual investment decisions are based on our proprietary models. The conclusions based on the study in this letter may or may not be consistent with JLFMI’s actual investment posture at any given time. Additionally, the commentary provided here is for informational purposes only and should not be taken as a recommendation to invest in any specific securities or according to any specific methodologies. Proper due diligence should be performed before investing in any investment vehicle. There is a risk of loss involved in all investments.