
Is Latin America About To Heat Up?
Latin American stocks are testing a potentially key line of support.
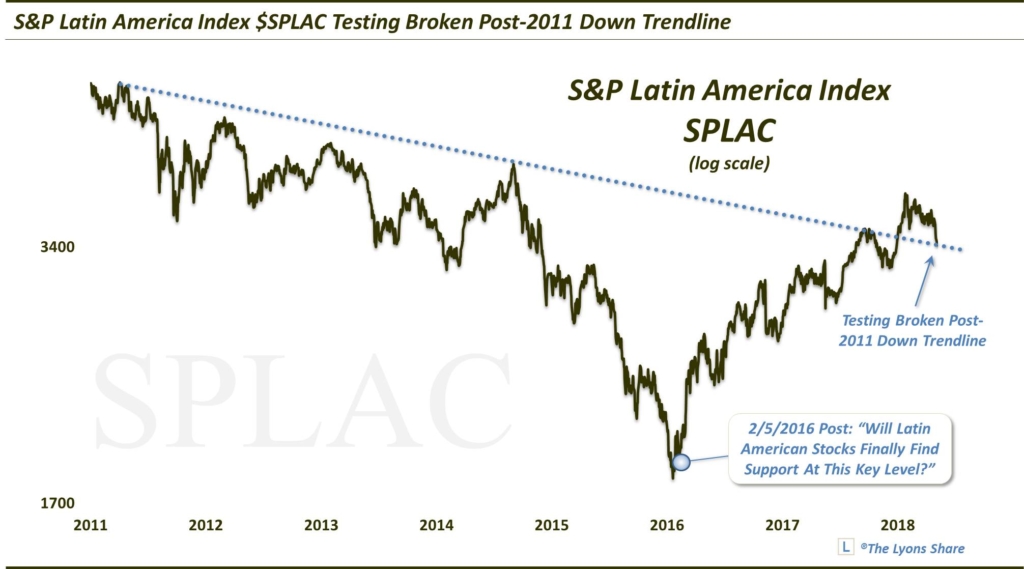
Of all the horror stories from the 2015-2016 global stock market correction, perhaps the scariest was Latin America. At its low-point in early 2016, the benchmark S&P Latin America Index (SPLAC) was was down more than 70% from its 2008 peak — and nearly 60% off of its 2014 peak. Things were so bad, in fact, that the SPLAC actually dropped briefly below its 2008 low to register a new low for the decade. In a post published near its cycle low in February 2016, we wondered Will Latin American Stocks Finally Find Support at that key level? From the post:
“In this case, things are so bad they may be good. The 2008 low is a major low that should produce some sort of a bounce, at least in the short-term. Whether it will produce a sustainable bull market remains to be seen.”
As it turns out, the SPLAC did indeed bounce from there — with a vengeance. By 2 years later, the SPLAC had jumped more than 120%.
Of course it had to break through some considerable resistance along the way to more than doubling. One resistance point, in particular, that we highlighted last fall was the Down trendline stemming from SPLAC’s 2011 top and connecting its 2014 peak. Back in September of last year, in the midst of a red-hot run, the SPLAC found itself bumping up against the bottom of that Trendline. That obstacle had us pondering whether it was Time For Hot Latin Stocks To Cool Off?
Our technical read was once again accurate as the SPLAC would fail a month-long test of the trendline, at least temporarily. After dropping by as much as 12.5% into December, SPLAC began its next comeback. By early 2018, it finally broke the post-2011 Down trendline, rising as much as 25% off of its December low.
Then the post-January global equity market correction hit and SPLAC was not immune to the damage. In fact, while most markets have sprung to life of late, SPLAC is plumbing new lows for 2018. Of particular note, the decline has now brought the index all the way back down to test the top side of the broken post-2011 Down trendline.
Now the theory goes that resistance, once broken, then becomes support — at least, the bulls would like to see it play out that way. Do we think it will? Certainly support is innocent until proven guilty, so we’d give the trendline the benefit of the doubt here. And if it does hold, it could provide the springboard for the next big up-leg in Latin American stocks. On the other hand, failure to hold above the trendline could be an ugly development, leaving a potential false breakout on the chart.
All that said, this is but one one line on the chart — and but one piece of evidence to consider when pondering an investment in Latin American stocks. In our Daily Strategy Videos for TLS members, we have been presenting other key chart levels of note, as well as inter-market forces that may provide better insight into which way this trendline test is going to go.
If you’re interested in the “all-access” version of our charts and research, please check out our new site, The Lyons Share. You can follow our investment process and posture every day — including insights into what we’re looking to buy and sell and when. Thanks for reading!
_____________
Disclaimer: JLFMI’s actual investment decisions are based on our proprietary models. The conclusions based on the study in this letter may or may not be consistent with JLFMI’s actual investment posture at any given time. Additionally, the commentary provided here is for informational purposes only and should not be taken as a recommendation to invest in any specific securities or according to any specific methodologies. Proper due diligence should be performed before investing in any investment vehicle. There is a risk of loss involved in all investments.