Volatility Floored (PREMIUM-UNLOCKED)
The following post was initially issued to TLS members on May 11, 2018.
The VIX may struggle to move much lower than current levels — and may signal limitations to further stock market gains.
Some folks argue that technical analysis cannot be applied — and therefore should not be attempted — on volatility markets. We actually used to be in that camp but, given the evidence we’ve observed over time, we have changed our tune. We think support and resistance levels, particularly via trendlines, have been readily identifiable on many occasion. And one pretty significant signal in that regard may be in the works at the moment.
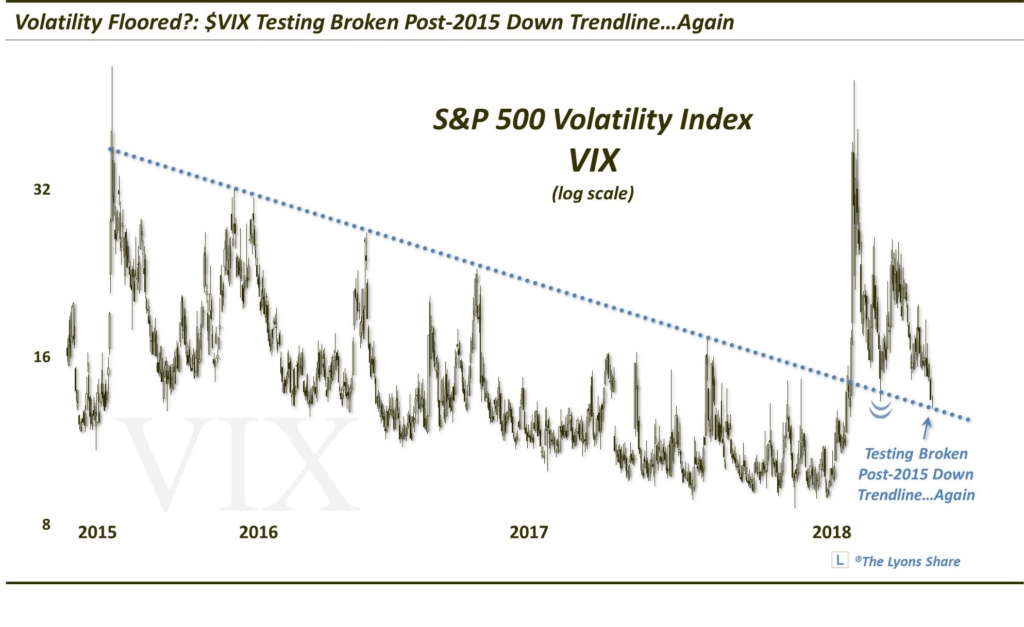
Since its high in 2015 (coinciding with the S&P 500 low), we’ve seen a discernible downtrend in the VIX (S&P 500 Volatility Index). Not only that, but the intermittent VIX peaks over that time serve to form a nearly pristine Down trendline on the chart. Now, it seems that the likelihood of such a clean trendline forming at random is nearly inconceivable. However, we’ll let pundits and philosophers opine on the topic of TA and volatility charts. We are operating under the assumption that recent action is notrandom — and that such analysis can assist us, at times, in our stock market decision-making. One of those times, again, may be now.
As the chart shows, the VIX did finally break above its post-2015 Down trendline in late January/early February of this year. After its subsequent spike into early February, the VIX settled back down. Where did it find support? Right on the top of the broken post-2015 Down trendline on March 9. While it was bouncing firmly off of that support, stocks were, at the same time, stalling out, eventually turning back down to test its February correction lows.
Following the VIX’s bump up in volatility into April, it has settled back down again. And presently, as stocks have bounced again, we find the VIX once again nearing a test of that broken post-2015 Down trendline.

As it did in March, the trendline may provide nearby support for the VIX. If successful, that may also serve as a signal that further upside in stocks may be tough to come by in the near-term.
Obviously, only prices will tell the story, but one reason we look at other indicators, e.g., breadth, sentiment, etc., is because price is not predictive. Other metrics can help us anticipate what prices are likely to do going forward. And at the present time, potential VIX support may again be signaling a possible roadblock, or pause, in the current stock market bounce. At a minimum, that would have us holding off on chasing stock prices higher. They certainly may end up moving higher, but the risk/reward prospects of buying stocks right here would not appear to be too favorable.
If you’re interested in the “all-access” version of our charts and research, please check out our new site, The Lyons Share. You can follow our investment process and posture every day — including insights into what we’re looking to buy and sell and when. Plus, our SPRING SALE (25% OFF!!) is going on now so it’s a great time to sign up! Thanks for reading!
_____________
Disclaimer: JLFMI’s actual investment decisions are based on our proprietary models. The conclusions based on the study in this letter may or may not be consistent with JLFMI’s actual investment posture at any given time. Additionally, the commentary provided here is for informational purposes only and should not be taken as a recommendation to invest in any specific securities or according to any specific methodologies. Proper due diligence should be performed before investing in any investment vehicle. There is a risk of loss involved in all investments.


1 Comment