Emerging Opportunity?: Brazil (PREMIUM-UNLOCKED)
This post, originally sent to TLS members on June 29, is one of a series updating our view on specific emerging markets — primarily due to compelling near-term circumstances.
Brazil’s benchmark Bovespa has failed to hold its breakout above last decade’s all-time highs.
In 2008, Brazil’s benchmark stock index, the Bovespa, topped out at an all-time high near 73,000. After nearly a decade-long lull, the Bovespa finally clawed its way back to that level for the first time late last summer. After a brief consolidation, the index pushed its way higher into February of this year, reaching as high as 88,000. Through the early year global equity correction, the Bovespa held firm, consolidating again near those highs into May. Then the bottom fell out.
In the middle of May, the index started dropping. Just 3 weeks later, it was back down to the breakout level of its former highs of a decade ago. We wondered if that former resistance level would now work as support. So far, it has not.

As the chart shows, the Bovespa immediately sliced through its former highs. This leaves the specter of a potential “false breakout” on the chart. Especially considering the magnitude of the attempted breakout (i.e., a level of decade-long importance), a false breakout could bring dire consequences.
So is it a false breakout? Or should this market be given some leeway before making a judgement? Well, if you’ve been watching/listening to our Daily Strategy Sessions, you know that we deem another level just below the 73,000 mark as more critical support. Specifically, it is the approximate 69,000 level which includes an impressive confluence of potential support — largely of the Fibonacci variety:
- 23.6% Fibonacci Retracement of the 2002-2018 Rally
- 38.2% Fibonacci Retracement of the January 2016-2018 Rally
- 61.8% Fibonacci Retracement of the Rally from the December 2016 Breakout to 2018
- 500-Day Simple Moving Average (not shown)
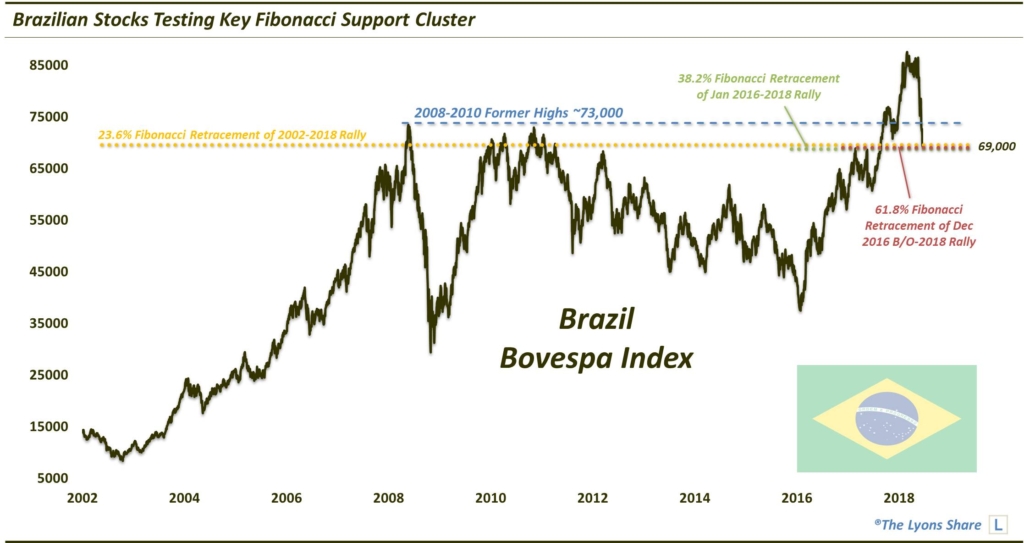
So, will this support hold? We are betting that it will, at least temporarily. Potential resistance, i.e., profit-taking, points are 73,000, 76,300, 78,600 and 81,000.
In the loooong- term, we are still substantially bullish on the prospects for emerging markets as many of them are working on breakouts of major, e.g., years or decades-long, bases. Once sustainably broken, it is likely that we see new secular, or at least cyclical, bull markets in these markets. And the potential upside in that scenario could be massive.
However, in between that loooong-term and the potentially imminent near-term bounce, we envision more testing/consolidating/base-building for some time prior to a new bull market. That is likely particularly so should the U.S. Dollar continue to rally in the intermediate-term, as we envision.
However, we should at least see a short-term bounce prior to the next bout of weakness.
If you’re interested in the “all-access” version of our charts and research, please check out our new site, The Lyons Share. You can follow our investment process and posture every day — including insights into what we’re looking to buy and sell and when. Thanks for reading!
_____________
Disclaimer: JLFMI’s actual investment decisions are based on our proprietary models. The conclusions based on the study in this letter may or may not be consistent with JLFMI’s actual investment posture at any given time. Additionally, the commentary provided here is for informational purposes only and should not be taken as a recommendation to invest in any specific securities or according to any specific methodologies. Proper due diligence should be performed before investing in any investment vehicle. There is a risk of loss involved in all investments.