Emerging Opportunity?: Thailand (PREMIUM-UNLOCKED)
This is one of a series of posts updating our view on specific emerging markets — primarily due to compelling present circumstances.
Thai stocks have pulled back from decades-old resistance to test their recent key breakout level.
2017 saw a myriad of major breakouts in emerging markets around the globe. One such market was Thailand, which we noted in a premium post to members of The Lyons Share last September: “The Best Opportunity In The Equity World Right Now?”. At the time, Thailand’s benchmark SET stock index was breaking above a Down trendline stemming all the way back to its 1994 all-time highs, and connecting peaks in 2013, 2015 and 2017. As the post’s title suggested, it looked to us like an excellent buying opportunity near the approximate 1585 breakout level.
An obvious target that we noted at the time was that all-time high from 1994 near the 1800 level. A few days into 2018, the SET did indeed reach that peak, as we updated in another post: “New Highs For This Emerging Market? It’s About THAI-m”. That doesn’t mean we were buying more Thai exposure there, however. In fact, as we mentioned in the post, we preferred to wait for a pullback to a certain spot first:
“…it is almost a certainty that there will be some sort of pause, consolidation, etc. prior to a sustainable breakout to all-time high ground. And whatever pause that does unfold may take an extensive amount of time to play out. Therefore, we would wait for a more favorable point, in terms of price and time, before adding extensive new exposure to Thailand. How do we find such a juncture?
The first thing we look for is a compelling level of support below that might be most reliable in producing a bounce. It doesn’t guarantee that prices will get there. However, we want to add money at the most favorable risk/reward junctures. Thus, being patient in waiting for such a level is a choice we are comfortable with considering the potentially formidable nature of the present resistance. Where might that level be?
The most obvious level is the September breakout point above the post-1994 Down trendline from which this current bounce was launched. That level, again down around 1580, is about 12% lower. We also always make it a point to locate critical clusters of Fibonacci Retracements below, if any, that would provide natural targets and staunch support. In this case, there are a few clusters that line up nicely.”
Fast forward a half a year and the benchmark Thai index has arrived at that breakout level, hitting a low at precisely 1585 this past week.
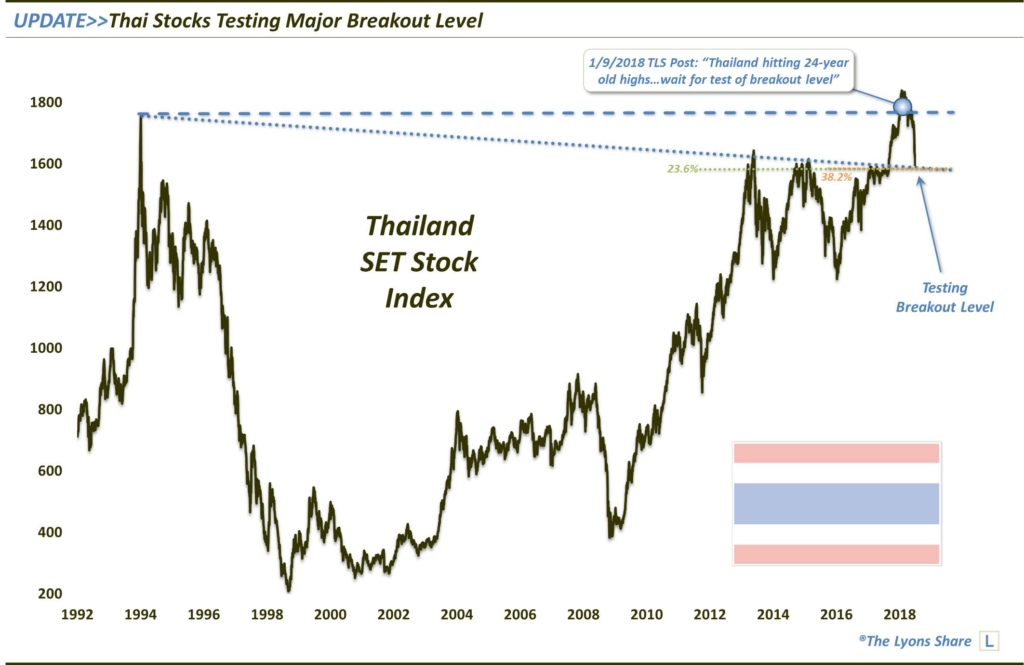
As indicated, along with the breakout level in this vicinity, several key Fibonacci Retracement levels are nearby, namely the 23.6% Fibonacci Retracement of the 2011-2018 rally and the 38.2% Fibonacci Retracement of the 2016-2018 rally.
So, will this support hold? Our guess is that it does, at least temporarily. Potential resistance, i.e., profit-taking, points are 1650, 1690, 1720 and 1750 (of course, these levels are subject to change based upon price action).
What about an investment vehicle through which to take advantage of this potential opportunity? In the U.S., the easiest and most direct option for Thai equity exposure is the iShares Thailand ETF (ticker, THD). And while equity ETF’s are often challenged when it comes to tracking its local index, THD also has a potentially key technical level (e.g., the post-2008 Up trendline) in its favor near the current ~$81 price.
In the loooong- term, we are still substantially bullish on the prospects for emerging markets as many of them are working on breakouts of major, e.g., years or decades-long, bases. Once sustainably broken, it is likely that we see new secular, or at least cyclical, bull markets in these markets. And the potential upside in that scenario could be massive.
However, in between that loooong-term and the potentially imminent near-term bounce, we envision more testing/consolidating/base-building for some time prior to a new bull market. That is likely particularly so should the U.S. Dollar continue to rally in the intermediate-term, as we envision.
However, we should at least see a short-term bounce prior to the next bout of weakness.
If you’re interested in the “all-access” version of our charts and research, please check out our new site, The Lyons Share. You can follow our investment process and posture every day — including insights into what we’re looking to buy and sell and when. Thanks for reading!
_____________
Disclaimer: JLFMI’s actual investment decisions are based on our proprietary models. The conclusions based on the study in this letter may or may not be consistent with JLFMI’s actual investment posture at any given time. Additionally, the commentary provided here is for informational purposes only and should not be taken as a recommendation to invest in any specific securities or according to any specific methodologies. Proper due diligence should be performed before investing in any investment vehicle. There is a risk of loss involved in all investments.