The Best Opportunity In The Equity World Right Now? (PREMIUM-UNLOCKED)
On the heels of a flurry of impressive breakouts across emerging markets this year, Thailand may be the next to soar.
When it’s all said and done, 2017 might be viewed as the year of the re-emerging Emerging Markets (EM). Perhaps they have not seen, nor will see, the kind of stratospheric returns that we’ve seen in years past this year. However, considering the magnitude of breakouts unfolding all across EM land, we may be witnessing the beginning of something very, very big. The breakouts have ranged from recent key breakouts above near-term resistance in established EM countries like Brazil, China and Russia — to massive breakouts above years or decades-long resistance in some of the smaller EM countries like Taiwan, Indonesia and South Africa. Today’s Chart Of The Day on Thailand fits with that latter group — and it just may represent the best opportunity in the global equity markets at the moment.
Like some of the other Asian Tigers, or Tiger Cubs, Thailand’s SET Stock Index (SET) has basically gone nowhere for the past few decades. After topping just shy of 1800 in 1994, the SET was front and center in the Asian Crisis in the latter half of the decade. By 1998, the SET had dropped to near 200, or a loss of roughly 90% of its former value.
After that, the index proceeded to claw its way back towards its former highs — though, it would take awhile…a long while. Following the financial crisis in 2008, the SET really kicked into gear, rallying from about 350 to a high in 2013 near 1650. Since that point, the index has been basically moving sideways within a trading range between 1250 and 1650.
That long trip down from 1994 and back up again in 2013, followed by the recent trading range has created a possible modified “cup-&-handle” formation. Of course, this is a potentially very bullish formation, once prices do break out above the top of the pattern. That top is represented by a gently sloping Down trendline connecting the highs from 2013, 2015 and early 2017. The interesting thing is that if you extend the trendline back to the left, it essentially lines up with the all-time top back in 1994.
That multi-decade trendline/cup-&-handle top may be breaking as we speak.
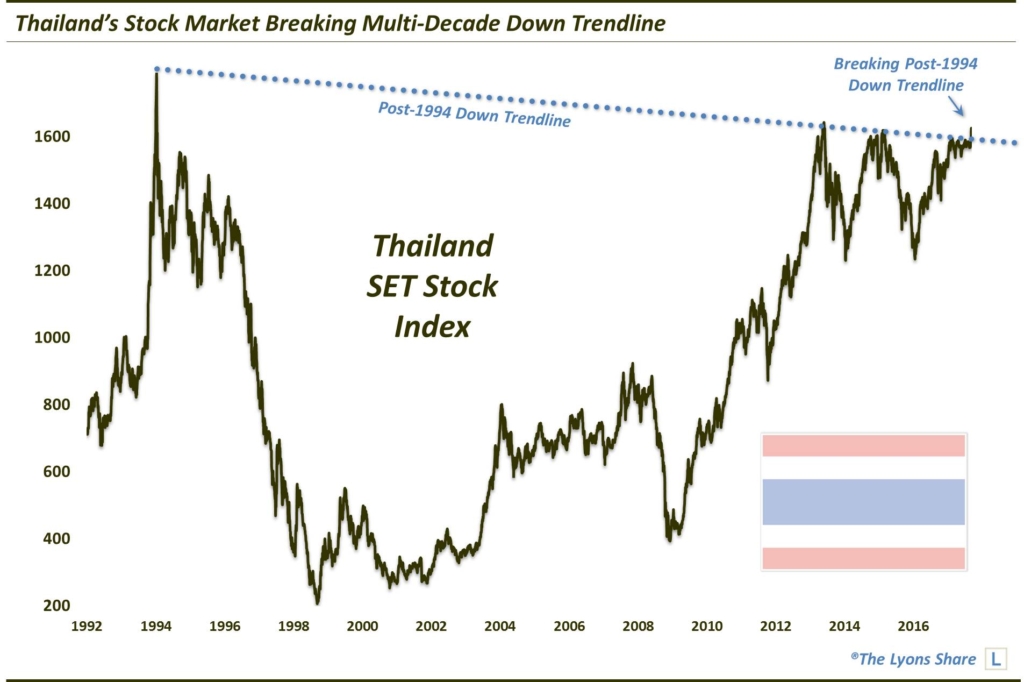
As the chart shows, SET prices have spiked up in recent days, corresponding with a break of that long-term trendline. The timing of this spike may make believers out of even the most ardent chart skeptics.
In any event, the first target after this breakout (occurring near the 1585 level) would be the 2013 highs up close to 1650. The index closed today at 1618, so that target isn’t too far away. That is not the ultimate prize, however. The next target would be the 1994 highs near 1800. That would be a handsome 10% gain from here. That is not the potential prize here either, however.
A breakout of this magnitude, if it unfolds and sticks, suggests a move to new all-time highs — and a substantial extension above there. We are talking about a new secular bull market.
So what sort of upside potential are we talking about? Here are the potential “targets” based upon various chart techniques that we have employed:
- 2000 (+21% above 1994 all-time high — this is the bare minimum potential “target”)
- 2500 (+51%)
- 2800 (+70% — highest confidence “target”?)
- 4000 (+142%)
- 4400 (+167%)
You can see why we are excited about this potential. Will it pan out? We obviously cannot know for sure. But if it seems improbable, remember that this market, like others in EM, have gone nowhere over the past few decades.
So what vehicles are available to play this opportunity? In the U.S., there is just one Thailand-focused ETF: the iShares MSCI Thailand Capped ETF, ticker, THD. Like all foreign equity ETF’s, the THD is not a perfect tracking device for its local equity market index. That said, it has done a decent job, historically, of tracking the general direction of the SET, over time. Presently, the THD is working on a breakout of its own, above the 61.8% Fibonacci Retracement (near 80.50) of the decline from its all-time high in 2013 to the 2016 lows. If it can sustain that breakout — and the SET can sustain its breakout — the THD should continue to do well. Furthermore, while the trade will have to be risk-managed (as does every trade), if the SET starts building toward the 1994 all-time highs, and then beyond, the THD could bring a potential windfall in the long run.
If you’re interested in the “all-access” version of our charts and research, we invite you to check out our new site, The Lyons Share, where we are currently running our PRE-“FALL” SALE. The SALE ends September 4 so considering the discounted cost and a potentially treacherous market climate, there has never been a better time to reap the benefits of our risk-managed approach. Thanks for reading!
_____________
Disclaimer: JLFMI’s actual investment decisions are based on our proprietary models. The conclusions based on the study in this letter may or may not be consistent with JLFMI’s actual investment posture at any given time. Additionally, the commentary provided here is for informational purposes only and should not be taken as a recommendation to invest in any specific securities or according to any specific methodologies. Proper due diligence should be performed before investing in any investment vehicle. There is a risk of loss involved in all investments.