Homewrecked (PREMIUM-UNLOCKED)
The following post was initially issued to The Lyons Share members on June 25, 2018. The subsequent low was 294.06 on June 28, 2018
Housing stocks are testing the major cluster of potential support that we have been stalking.
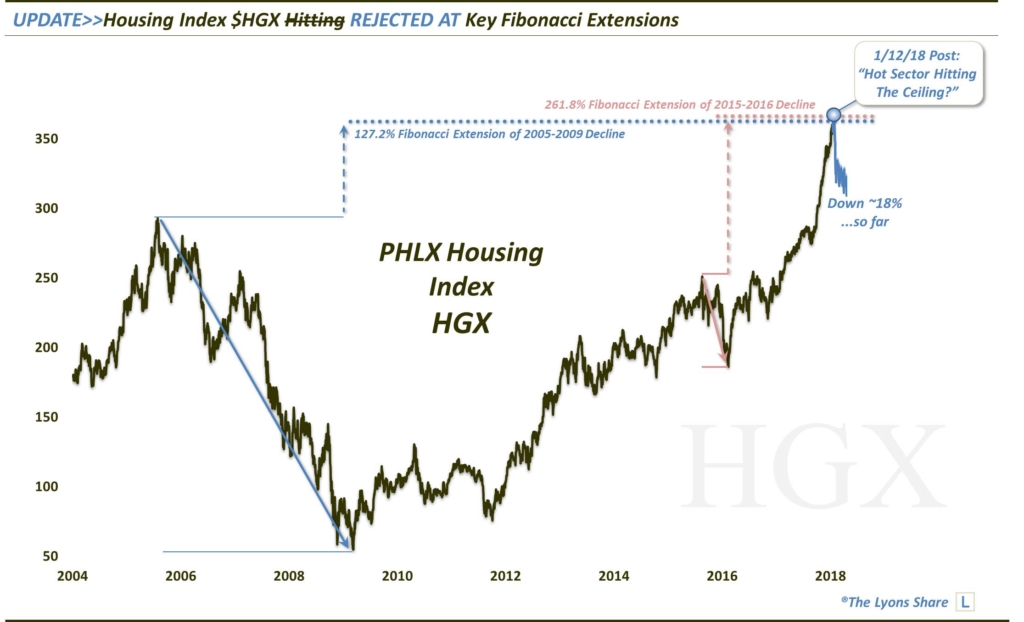
Back in January, we noted that one sector that had been on fire — housing stocks — was potentially at risk of cooling off. At least, that was our read on the group based on the chart of the PHLX Housing Sector Index (HGX). The HGX, at the time, had jumped more than 20% since breaking above its previous all-time high in late September. That high was set in 2005 near the 294 level. However, as we highlighted in the January post, the HGX had found its way up to 2 key Fibonacci Extensions near the 360-362 area:
- The 127.2% Fibonacci Extension of 2005-2009 Decline
- The 261.8% Fibonacci Extension of 2015-2016 Decline
In hindsight, we see that that juncture was indeed a good time to reduce exposure to housing stocks, as the HGX would top out just 7 days later, closing no higher than 365. And since then, it has been straight down for the HGX — to the tune of about -18%, as of today.
But while the HGX hit the ceiling in January, it may well be reaching the floor now. We say that as the index is finally reaching the layers of potential support that we have been targeting for some time now in our Daily Strategy Sessions as well as our Weekly Macro Market Report. Those layers of potential support near the 295 level are headlined by that former all-time high from 2005 that was broken back in September. But it is hardly the only piece of noteworthy support in the vicinity.
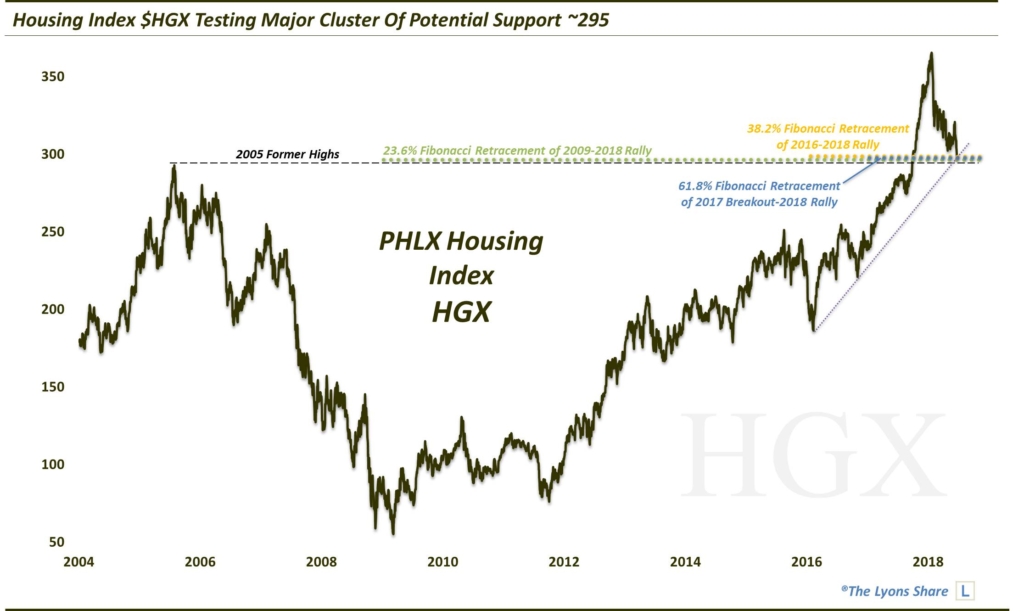
Also near the 295 area sits:
- The 23.6% Fibonacci Retracement of the 2009-2018 Rally
- The 38.2% Fibonacci Retracement of the 2016-2018 Rally
- The 61.8% Fibonacci Retracement of the Rally from the 2017 Breakout to-2018
- The Post-2016 Up Trendline
Despite the recent carnage in the housing sector, this confluence of levels should provide enough support to at least stabilize prices, and likely generate a considerable mean-reversion bounce. If the index undercuts this 295 area, be on the lookout for a false breakdown and a prompt recovery of the level.
We won’t necessarily be looking for new all-time highs into a potential bounce. But it should produce enough of a retracement, e.g., to ~325 (+10%) or ~340 (+15%) to make this a worthwhile trade from a risk/reward basis.
Our favorite ETF for taking advantage of this opportunity is ITB, or the iShares US Home Construction ETF. It is trading with a very tight correlation to the HGX and has a much cleaner chart than XHB. We are looking at support near the 37.00-37.35 area on ITB — or, the rough equivalent of HGX ~295.
As always, stay tuned to the Daily Strategy Sessions and Weekly Macro Market Reports for updates as this attractive potential long trade unfolds.
If you’re interested in the “all-access” version of our charts and research, please check out our new site, The Lyons Share. You can follow our investment process and posture every day — including insights into what we’re looking to buy and sell and when. Thanks for reading!
_____________
Disclaimer: JLFMI’s actual investment decisions are based on our proprietary models. The conclusions based on the study in this letter may or may not be consistent with JLFMI’s actual investment posture at any given time. Additionally, the commentary provided here is for informational purposes only and should not be taken as a recommendation to invest in any specific securities or according to any specific methodologies. Proper due diligence should be performed before investing in any investment vehicle. There is a risk of loss involved in all investments.