
Long Bond At A Crossroads (PREMIUM-UNLOCKED)
The following post was originally sent to TLS members on July 9, 2018.
The 30-Year U.S. Treasury Yield is testing important support marked by the intersection of key Up and Down trendlines.
In February, we noted that the 30-Year U.S. Treasury Yield (TNX) was testing what we termed a major “regime” line. As stated, “interest rates, of course, have been in a secular downtrend for the last 3 1/2 decades. Since the financial crisis, however, rates have been especially depressed in what we have referred to as the “ultra low-rate” yield regime.” In February, the TYX broke above the post-2011 Down trendline that we considered the defining line of the “ultra low-rate regime.” Since then, the TYX has tested the top of that broken trendline on several occasions, holding above each time. Presently, we find the trendline being tested once again near the 2.95% level — with a kicker.
Along with the broken post-2011 Down trendline, the TYX is also testing the post-2016 UP trendline stemming from its near all-time low yield in 2016.
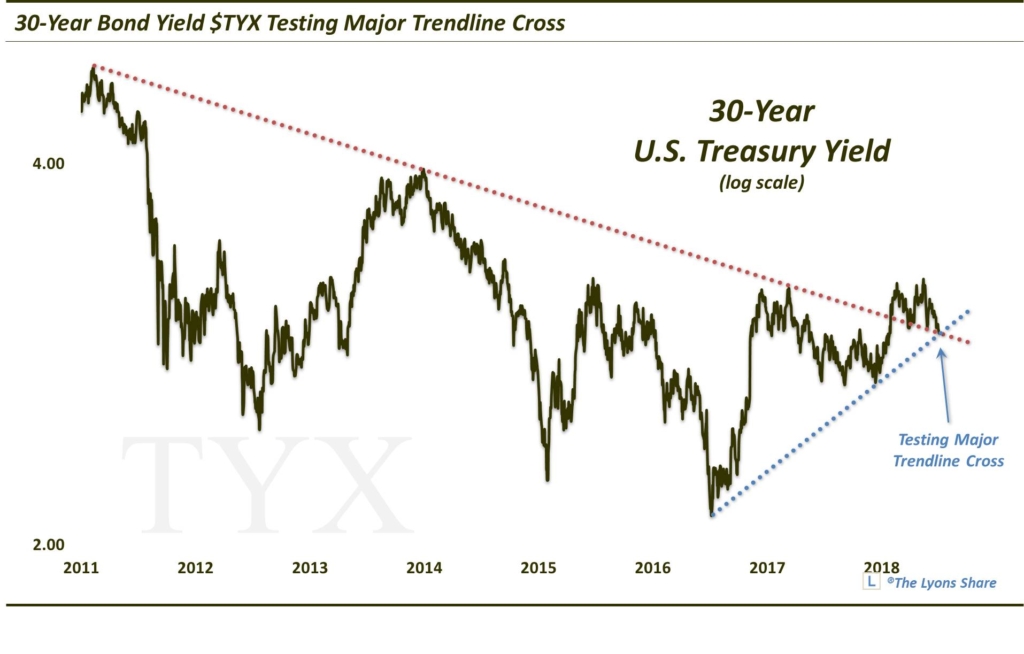
The TYX reaction here should be key in dictating the near-term direction of long-bond yields. For now, we continue to give the benefit of the doubt to the upside in yields — and, conversely, downside in price. Therefore, near present TYX levels (~2.95%), the risk/reward setup appears to be attractive for shorting 30-Year U.S. Treasury Bonds. Of course, any decisive close below 2.95% would suggest stopping out on that short.
One factor perhaps lending credence to the potential for a breakdown below 2.95% is the fact that the 10-Year U.S. Treasury Bond (TNX) is well above similar support. Thus, if TNX is to test such support, it is a good bet that 2.95% will fail, at least temporarily.
If 2.95% does hold as support, solid upside resistance still lies up around 3.20%-3.25%. Not only are the 2015, 2016, 2017 and 2018 highs in that vicinity, but (not coincidentally), so are the following key Fibonacci lines:
- The 23.6% Fibonacci Retracement of the 2000-2016 Decline
- The 38.2% Fibonacci Retracement of the 2009-2016 Decline
- The 61.8% Fibonacci Retracement of the 2014-2016 Decline
Thus, just as 2.95% should be support indefinitely, 3.25% should be resistance — until broken.
If you’re interested in the “all-access” version of our charts and research, please check out our new site, The Lyons Share. You can follow our investment process and posture every day — including insights into what we’re looking to buy and sell and when. Thanks for reading!
_____________
Disclaimer: JLFMI’s actual investment decisions are based on our proprietary models. The conclusions based on the study in this letter may or may not be consistent with JLFMI’s actual investment posture at any given time. Additionally, the commentary provided here is for informational purposes only and should not be taken as a recommendation to invest in any specific securities or according to any specific methodologies. Proper due diligence should be performed before investing in any investment vehicle. There is a risk of loss involved in all investments.


1 Comment