Are “Risk-Off” Indicators Aligning? (PREMIUM-UNLOCKED)
This post was originally issued to TLS members on August 10, 2018.
Our “risk-on/risk-off” indicators are giving preliminary warning signs.
In analyzing risk in the market, we predominantly rely on quantitative models that we’ve developed over the years. As you know, however, we do like to track other indicators that we’ve found helpful in instructing us as to the “risk-on” vs. “risk-off” situation in the market. These indicators can provide helpful clues as to the potential strength or durability of market rallies. In this post, we recap the status of 3 of them — given their potentially noteworthy behavior at the moment.
High-Beta Vs. Low-Volatility (Status: Threatening switch to risk-off)
One such risk-on indicator can be found in the “high-beta” area of the market – especially in its behavior relative to “low-volatility” stocks. To track these groups, we use the Invesco S&P 500 High Beta ETF (SPHB) and the Invesco S&P 500 Low Volatility ETF (SPLV). We have found that typically when the ratio of SPHB to SPLV performance is rising (e.g., 2012-2015, 2016-2018), it is an indication of “risk-on” – and constructive for the prospects of the overall market. When the ratio turns lower (e.g., 2011, 2015-2016), we’ve found the opposite message to be true, i.e., “risk-off”. This chart illustrates that idea.
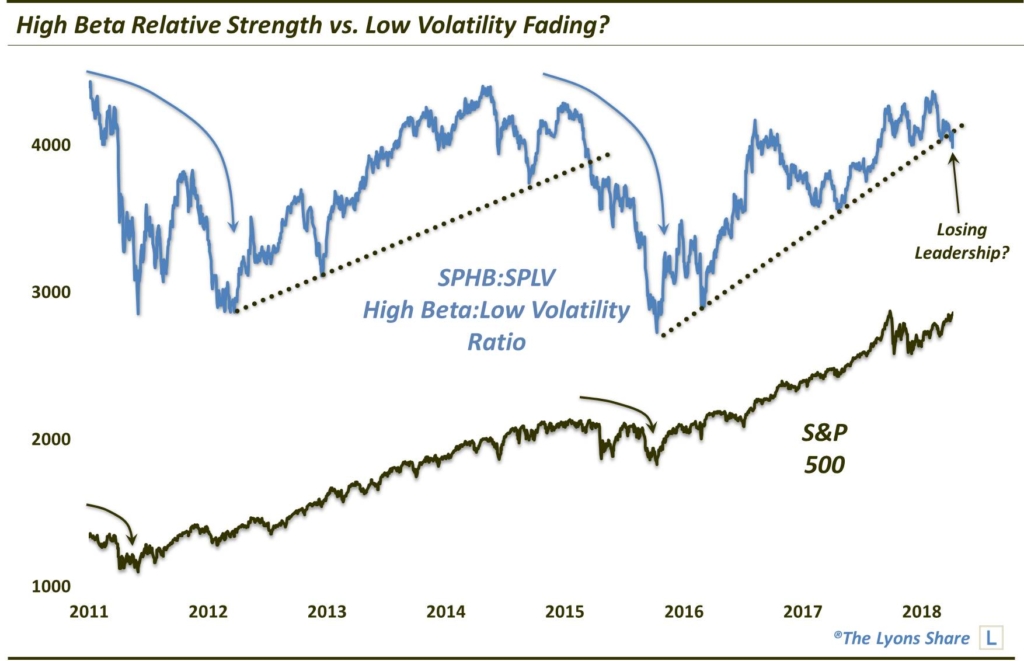
What’s the current message being sent by the ratio? As one can see on the right of the chart, the SPHB:SPLV ratio is threatening to break its post-2016 uptrend. While it’s too soon to decisively reach that conclusion, we would argue that such a development would be a negative for the prospects of a continued, durable risk-on move in the stock market.
Small-Cap Pure Value (Status: risk-on conditions fading)
When it comes to market “styles” (e.g., small, mid, large-cap and growth vs. value), the small-cap pure value style traditionally has the highest beta. And like the “high-beta” stock segment mentioned above, the S&P 600 Small-Cap Pure Value Index (SPSPV) typically leads the way in a legitimate risk-on market rally. For example, the SPSPV led the way higher during the beginning of rallies starting in January and November 2016, August 2017 and February of this year. When the SPSPV starts to fade, however, it may be an early warning sign that the further durability of a rally may be in question.
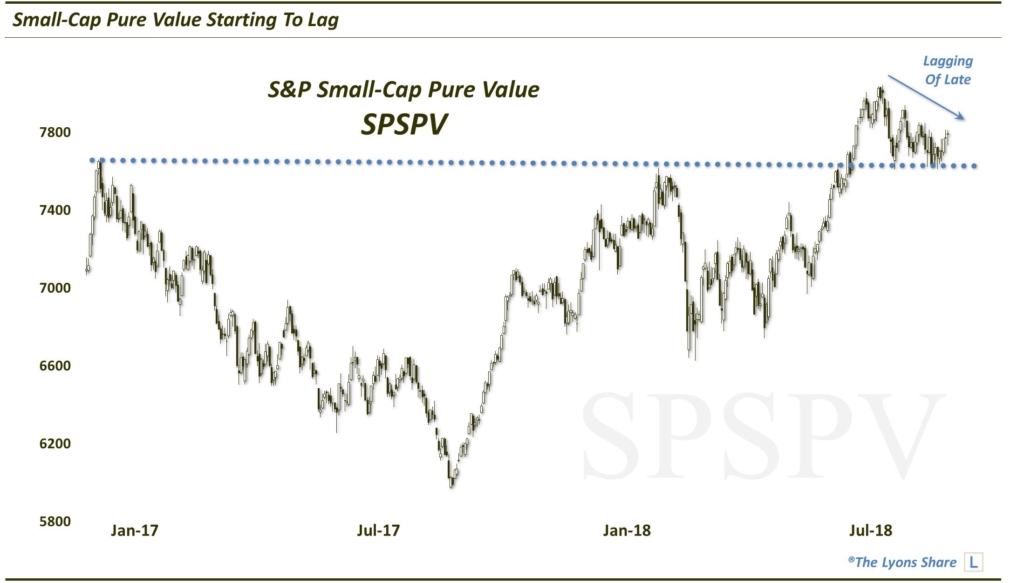
Presently, the SPSPV is lagging badly behind most of the other style segments. After breaking out to new highs in May, the SPSPV has retreated over the past 2 months. Now it is still above its breakout point and may merely be consolidating its rally. However, this recent under-performance will need to be monitored, especially if the SPSPV fails to get back into rally gear during a potential breakout in the overall market. Such a divergence may foretell a failed breakout.
High Yield Bonds (Status: risk-on status being tested)
The last indicator we’ll look at is the high yield bond market. As high yield represents the riskiest of all bonds, the space actually trades in concert with equities much of the time. Thus, when high yield bonds are rallying, it is indicative of risk-taking, which generally includes a rallying stock market. When the high yield space turns down, it can be a sign of risk aversion — and a cautionary sign for stocks.
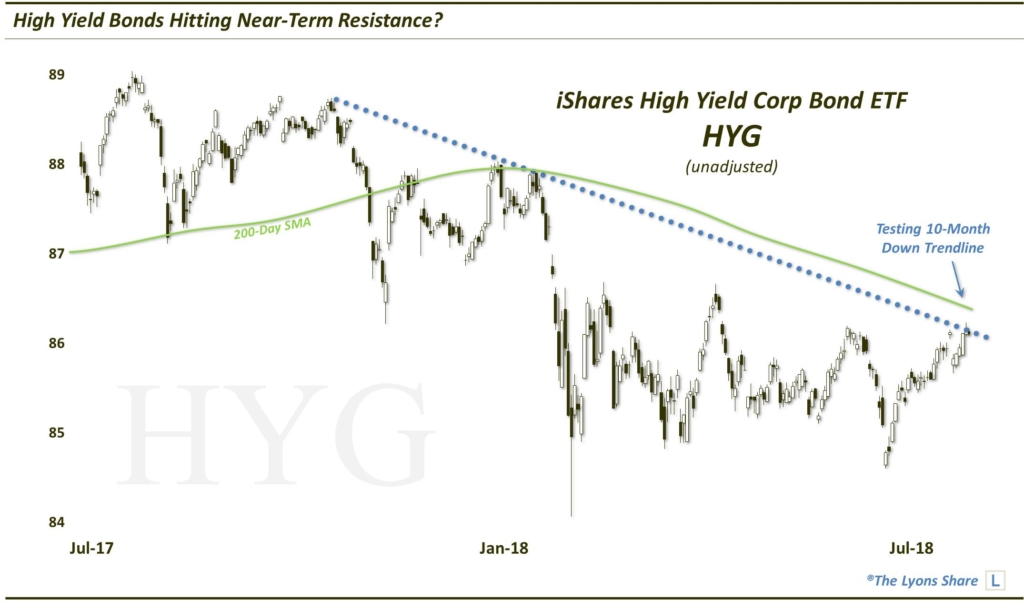
Recently, the high yield space has been behaving fairly well — at least maintaining an upward trajectory. However, based on one representative of the space, the iShares High Yield Corporate Bond ETF (HYG), it is running into some potential resistance on its chart (at least on an unadjusted basis). Specifically, the HYG is encountering a Down trendline from its November 2017 peak and is approaching its falling 200-day simple moving average. These obstacles may not necessarily be enough to meaningfully reverse the recent uptrend, or completely end risk-taking for that matter, but they may be enough to temporarily put a hold on the “risk-on” rally in the HYG — and perhaps in the stock market.
Taking stock of the combination of these 3 “risk-on/risk-off” measures, we find adequate reason for some concern. There are certainly enough positives in the market to maintain moderate long exposure to stocks. Furthermore, the broad market would appear to be setting up for a breakout to new highs. However, given the status of these risk indicators, an aggressive play on the potential breakout is probably not warranted. Furthermore, should the broad market break out, and these risk measures fail to follow along, it could be an indication of a likely failed, or temporary, breakout.
If you are interested in an “all-access” pass to our research and investment moves, we invite you to further check out The Lyons Share. FYI, we are currently holding our BLACK FRIDAY SALE — our BIGGEST SALE OF THE YEAR. So considering the discounted cost and the current treacherous market climate, there has never been a better time to reap the benefits of our risk-managed approach. Thanks for reading!
_____________
Disclaimer: JLFMI’s actual investment decisions are based on our proprietary models. The conclusions based on the study in this letter may or may not be consistent with JLFMI’s actual investment posture at any given time. Additionally, the commentary provided here is for informational purposes only and should not be taken as a recommendation to invest in any specific securities or according to any specific methodologies. Proper due diligence should be performed before investing in any investment vehicle. There is a risk of loss involved in all investments.