Price Rollback On Walmart Stock (PREMIUM-UNLOCKED)
The following post was initially issued to TLS members on February 23, 2018.
The stock of Walmart has dropped down to test the level of its November breakout to all-time highs.
Back in October 2015, the stock of Walmart was in the throes of a decline so bad it had folks wondering if it would be “Always Low Prices” for WMT. Due to a profusion of potential technical support factors near the $60 level, just below its price at the time, we didn’t see it that way. Indeed after a brief test, WMT would rebound. And by last November, the stock had recovered all the way back to its all-time highs set in early 2015 near $90.
From November:
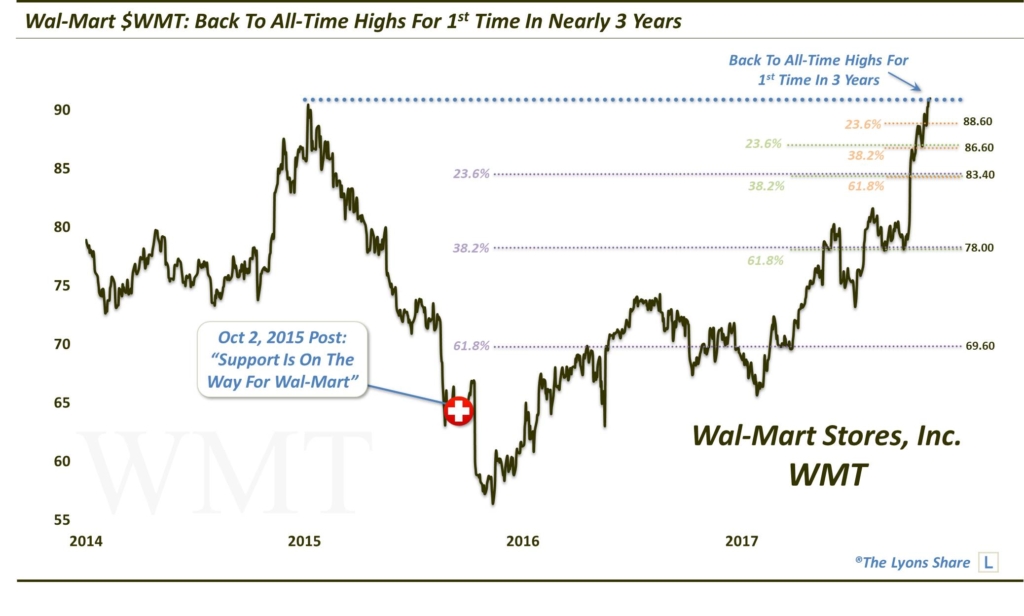
We noted this accomplishment in a post last November. In a Premium Post at The Lyons Share, we also speculated on what might be next for the stock, at least ideally:
“What’s next for Wal-Mart? Is the run over — or will a possible breakout kick-start a new substantial advance above previous highs.
First off, given the prominence of the former 2015 all-time highs in the vicinity of the $90, some consolidation or pullback from this level would not be surprising. In fact, as we have mentioned before, it would actually be a healthy development. An attempt at a breakout above the $90 level without some consolidation first would not likely be sustainable. After more than a 60% rally over the past 2 years — and nearly 40% just in the past 10 months — the stock likely lacks the necessary fuel for an immediate successful breakout and new durable up-leg.”
Well, the stock laughed at our idealism and continued to march directly higher, reaching as high as $110 by the end of January. But, as we surmised, that breakout, without resting first and refueling, has now been completely unwound. And we currently find the stock testing back near the breakout level around $90.
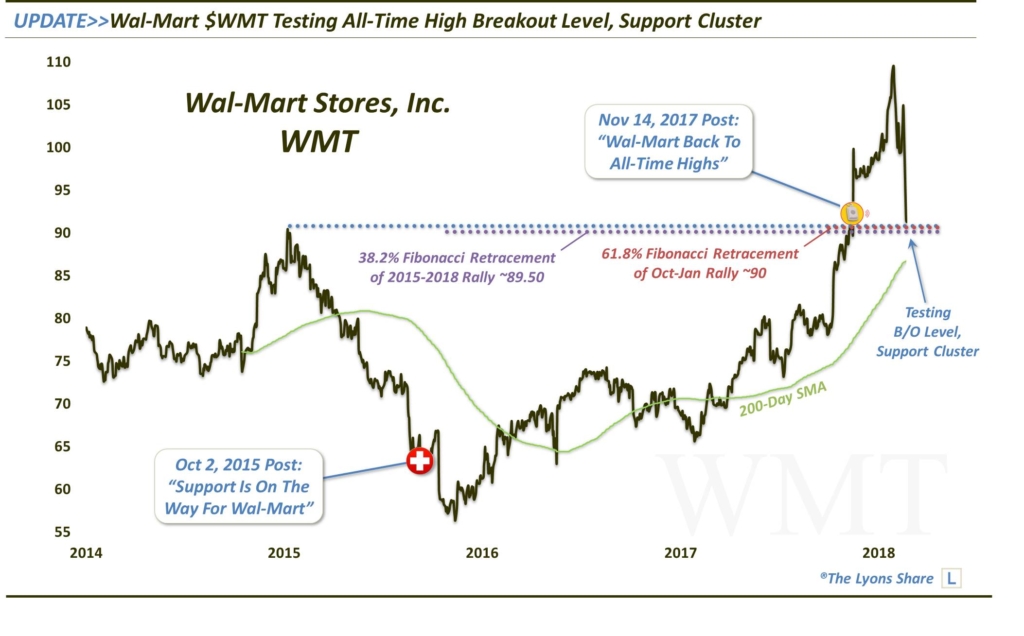
If you’ve followed us for awhile, you know that we are fond of buying tests of breakout levels. As such, from a risk/reward standpoint, this may be an attractive spot to pick up some WMT stock on the price rollback. Making the long case for WMT even stronger, there are a number of other factors going for it near the $90 level, including:
- The 38.2% Fibonacci Retracement of the 2015-2017 rally ~89.50
- The 61.8% Fibonacci Retracement of the rally off the October launch area to the January top ~90
- The rising 200-Day Simple Moving Average approaching the $90 level
We’re not big on the notion of coincidences in the markets, and thus, the presence of these factors near the $90 breakout level is likely no coincidence. Their proximity reinforces, to us, the importance of this level and makes it a more attractive entry point.
Of course, given the speed in which WMT has dropped in recent weeks, a bottom and reversal here may be a weeks-long or months-long process. It also may mean the $90 level gets undercut temporarily. However, a quick recovery of the level would leave the long prospects just as attractive, or more so. Only a decisive break of the 200-day SMA, and a hold below it, would have us disinterested in the long idea. Such a break could lead to a quick retracement to near the $80 level.
If you’re interested in the “all-access” version of our charts and research, please check out our new site, The Lyons Share. You can follow our investment process and posture every day — including insights into what we’re looking to buy and sell and when. Plus, our Pre-FALL Sale (25% OFF!!) is going on now so it’s a great time to sign up! Thanks for reading!
_____________
Disclaimer: JLFMI’s actual investment decisions are based on our proprietary models. The conclusions based on the study in this letter may or may not be consistent with JLFMI’s actual investment posture at any given time. Additionally, the commentary provided here is for informational purposes only and should not be taken as a recommendation to invest in any specific securities or according to any specific methodologies. Proper due diligence should be performed before investing in any investment vehicle. There is a risk of loss involved in all investments.