
Stocks In Cycle Sweet Spot? (PREMIUM-UNLOCKED)
The following post was originally issued to TLS subscribers on October 2, 2018.
Stocks are entering the best stretch of the 4-year Presidential cycle, historically speaking; but does the recent atypical cycle behavior nullify that optimism?
When it comes to investment decision-making inputs, seasonality is typically pretty low on the hierarchy for us. However, as we have written on occasion in the past, there are some seasonal tendencies that have proven to be rather consistent throughout the market’s history. Some tendencies are short-term patterns around month-end or holidays. Others are longer-term in nature, such as the 4-year Presidential cycle.
As we have noted in the past, the Presidential cycle has proven to be quite reliable over the years. At this particular time, bulls are hoping that’s the case since the cycle is entering its best stretch of the entire cycle, historically speaking.
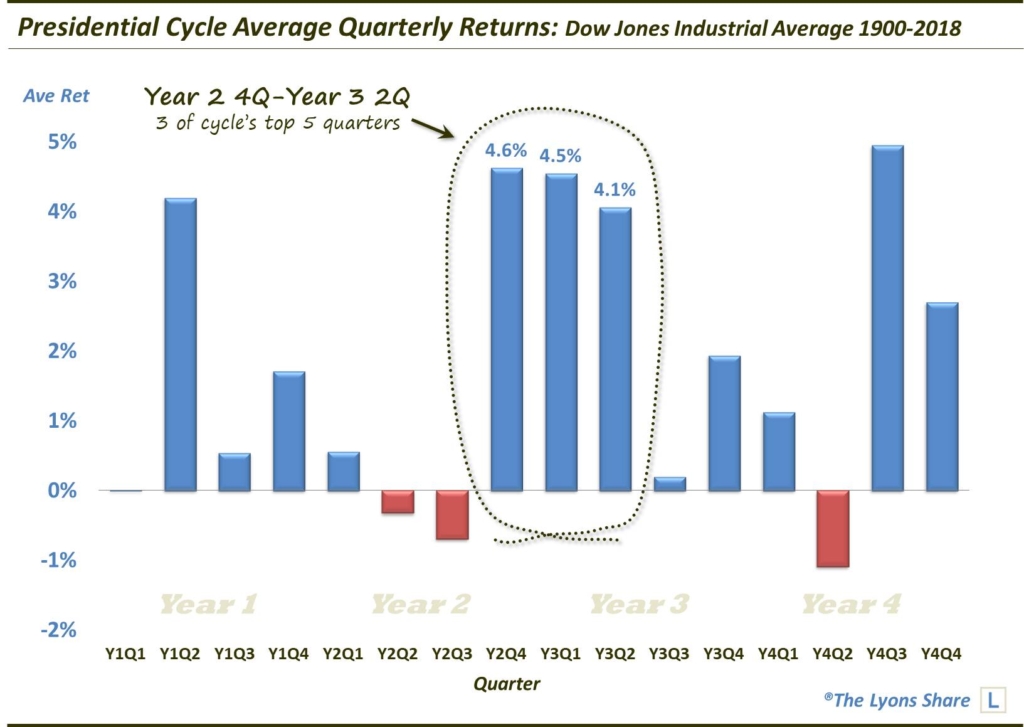
As the chart shows, the next 3 quarters represent 3 of the top 5 quarters in terms of average returns in the Dow Jones Industrial Average since 1900.
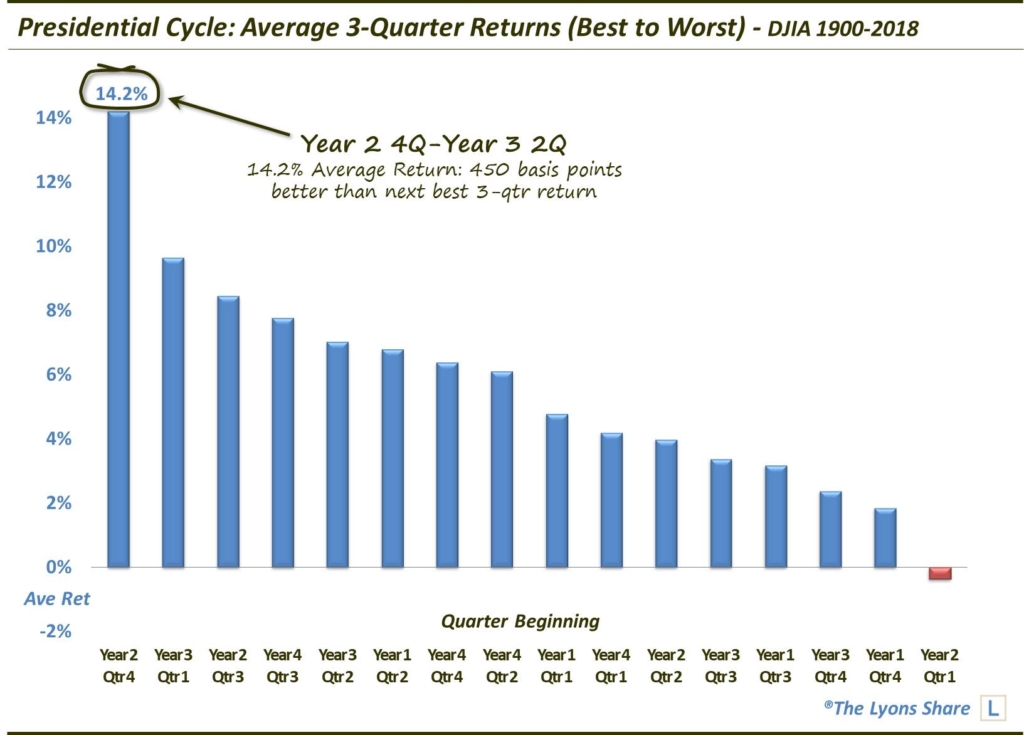
And, at an average return of +14.2%, the upcoming 3-quarter stretch has been, on average, more than 450 basis points better than the next best 3-quarter stretch.
Now, as we always note, seasonality is but a complimentary headwind or tailwind for stocks. There are certainly other more important factors in determining the path of the stock market. Thus, the historically “average” path does not always play out. Indeed, the 2-quarter stretch that just ended is historically the worst of the cycle. Yet, the stock market suffered little ill effects this time around.
So how will the recent out-performance (versus the average cycle) effect the upcoming “best stretch”? Let’s take a look.
- We know that the average return for the upcoming 3-quarter stretch is a robust +14.2% during all 29 Presidential cycles going back to 1900.
- Of those 29 periods, 13 of them followed a prior (typically poor) 2-quarter stretch that saw positive returns. The average return over the next 3 quarters among those 13 was +13.6%, just off of the overall average. Thus, this disputes the notion that because the recent period did not conform to the typical cycle pattern, the normally positive next 3 quarters is more likely to underperform.
- Furthermore, going back to 1982, the past 4 atypically strong 2 quarters ending in year 2, quarter 3 all saw gains over the next 3 quarters at an average of +18%. Not only that, but going back to 1942, 8 of the past 9 such atypically strong 2-quarter stretches saw continued gains over the subsequent 3 quarters at an average of nearly +20%.
- Oh, and by the way, regardless of how the prior 2-quarter stretch performed, the upcoming 3-quarter stretch has been positive during the past 9 Presidential cycles at an average of over +22% — and 18 of the past 19 cycles at an average of +21%.
So while the Presidential cycle did not follow its historically normal pattern over the past 2 quarters, there is no evidence to suggest that it will mitigate the positivity of the next 3 quarters. What does mitigate the positive seasonality, however, is the fact that we have small-cap and broader market breadth conditions that are starting to deteriorate in a material way. Now, it is possible that we get some sort of a nearer-term correction before finishing strong over the first half of next year.
All in all, this pattern has been impressively consistent throughout the last century. However, it’s not enough to override our current concerns and suggest a more aggressive posture.
If you are interested in an “all-access” pass to our research and investment moves, we invite you to further check out The Lyons Share. FYI, we are currently holding our HOLIDAY SALE, offering big savings for new members. So considering the discounted cost and the current treacherous market climate, there has never been a better time to reap the benefits of our risk-managed approach. Thanks for reading!
_____________
Disclaimer: JLFMI’s actual investment decisions are based on our proprietary models. The conclusions based on the study in this letter may or may not be consistent with JLFMI’s actual investment posture at any given time. Additionally, the commentary provided here is for informational purposes only and should not be taken as a recommendation to invest in any specific securities or according to any specific methodologies. Proper due diligence should be performed before investing in any investment vehicle. There is a risk of loss involved in all investments.