
Traders Build Back Hedges At Record Pace
Relative volume in inverse ETF’s hit an all-time high yesterday.
Perhaps one of the reasons for the swiftness in the present stock market selloff is the fact that traders were totally unprepared for it. At least, their investment allocation would suggest that as the level of protective hedges was extremely low by most measures heading into October. And certainly any efforts at identifying a sustainable bottom to the selloff must include a substantial turnaround in these conditions. Well, at least by one hedging source, we may close to a low of some significance.
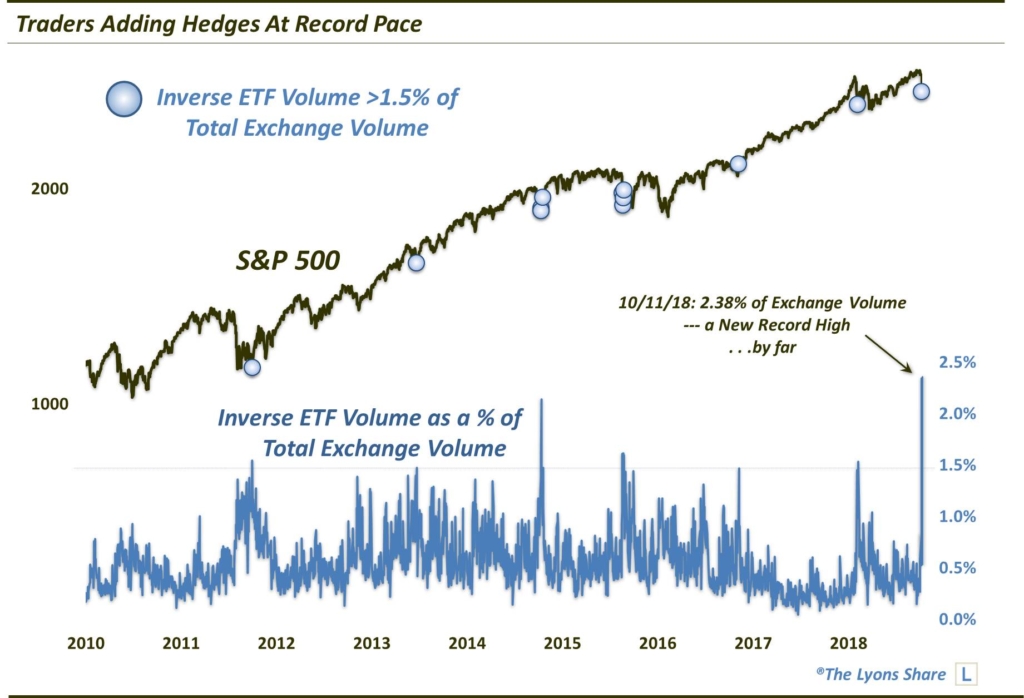
The source in question is inverse ETF’s, i.e., funds that go up when the market goes down. When action is extremely subdued in these funds, it can be a sign of complacency — and risk of decline as traders have little protection, or hedging, on. On the other hand, when we see extremely high volume being traded in these funds, it can be a sign of fear — and a potential bottoming signal. That latter condition may be valid now because yesterday saw the heaviest volume ever in inverse ETF’s, as a percentage of overall exchange volume.
FYI, the computation for this indicator, which we first saw utilized on sentimentrader.com, is a proprietary one. It does not include an exhaustive array of inverse ETF’s, but rather a group that we have been tracking now for about 5 years. Thus, someone else may come up with entirely different figures, though, likely the same general curve.
The interpretation of this data is pretty straightforward. As we said, high levels of Inverse ETF volume can indicate fear and set the stage for a market bottom. As the chart shows, that has been the case at times in the past. So for those looking for a bounce, this is certainly a feather in their cap. Of course, the question is how much of a bounce will we get and how long will it last?
If you’re interested in the “all-access” version of our charts and research, please check out our new site, The Lyons Share. You can follow our investment process and posture every day — including insights into what we’re looking to buy and sell and when. Thanks for reading!
_____________
Disclaimer: JLFMI’s actual investment decisions are based on our proprietary models. The conclusions based on the study in this letter may or may not be consistent with JLFMI’s actual investment posture at any given time. Additionally, the commentary provided here is for informational purposes only and should not be taken as a recommendation to invest in any specific securities or according to any specific methodologies. Proper due diligence should be performed before investing in any investment vehicle. There is a risk of loss involved in all investments.