
Trend Carefully 2
Highlighting even more important trendline tests currently underway across the financial markets, a development which suggests this is a key juncture.
Last week, we took the occasion to publish the set of charts from our weekly #TrendlineWednesday Twitter feature in a blog post. The reason being — the present number and importance of major trendline tests throughout the financial markets suggested that a key juncture in the markets may be at hand. After a week of chopping around (albeit, in a very volatile fashion), most of those key trendline tests are still in play. Furthermore, there are numerous other key trendlines being tested at the moment that either emerged this week or which we didn’t get a chance to share last week. So, we’ll share them now.
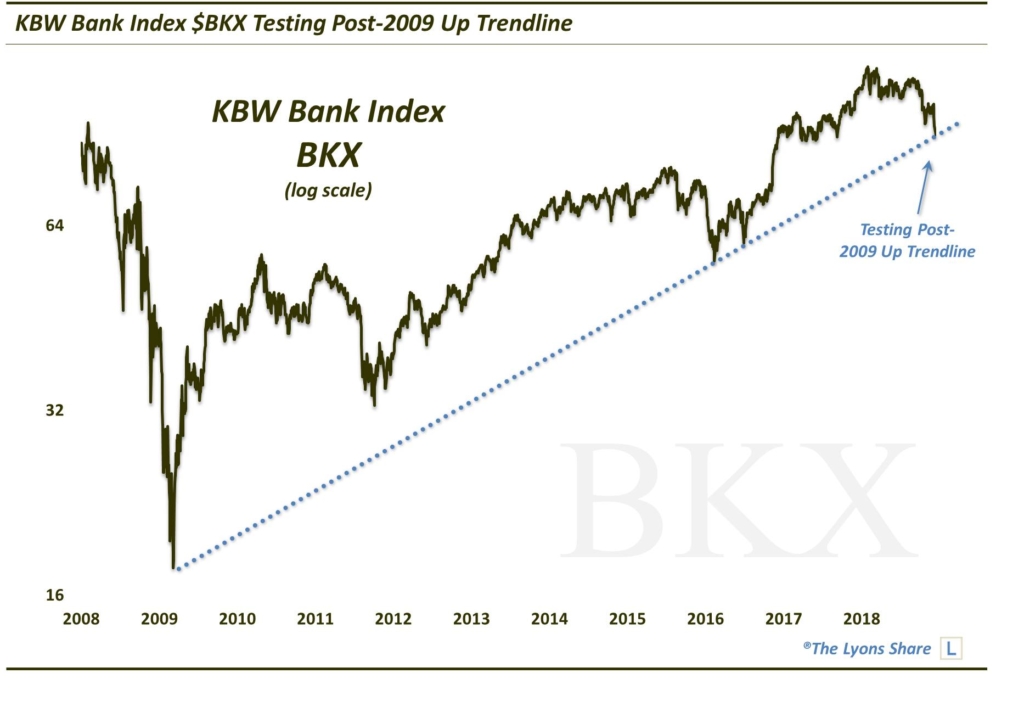
First off is our pick for trendline of the week from one of the most heavily watched sectors in the U.S. market. Namely, it is the KBW Bank Index (BKX), which is testing its post-2009 Up trendline.
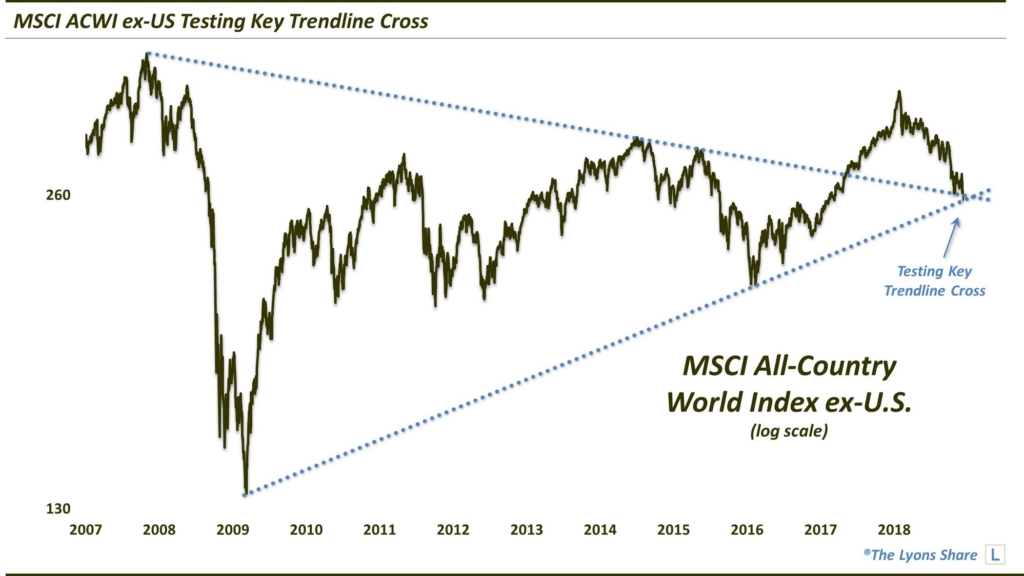
As we mentioned last week, it’s not just the domestic trendlines being tested right now. Many international markets are undergoing key trendline tests of their own. Not the least of these is the MSCI ACWI ex-US Index, which is testing an intersection of 2 major, longer-term trendlines — the post-2009 Up trendline and the broken post-2007 Down trendline.
Numerous individual country markets are also testing key trendlines as well, including the Australian ASX-200 which is testing its post-2009 Up trendline.

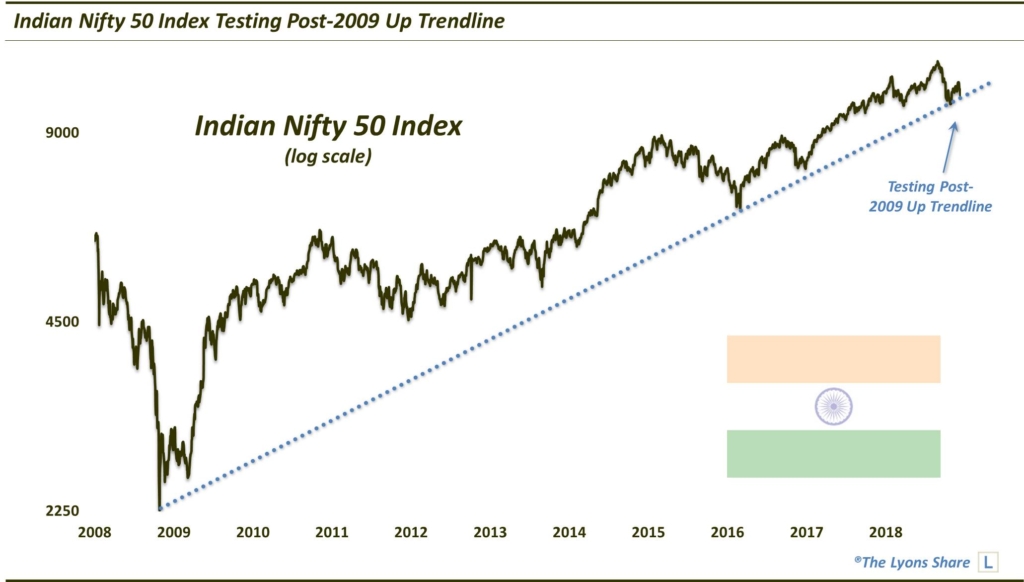
Also testing its post-2009 Up trendline is the Indian Nifty 50 Index.
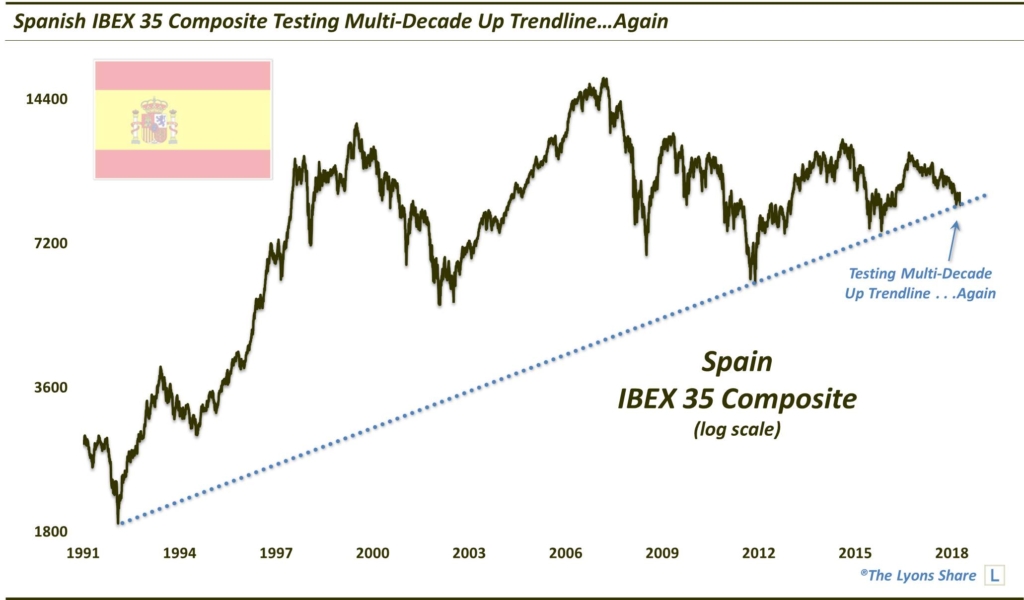
And reaching back further, Spain’s benchmark IBEX-35 Composite is testing a multi-decade Up trendline, stemming back to 1992.
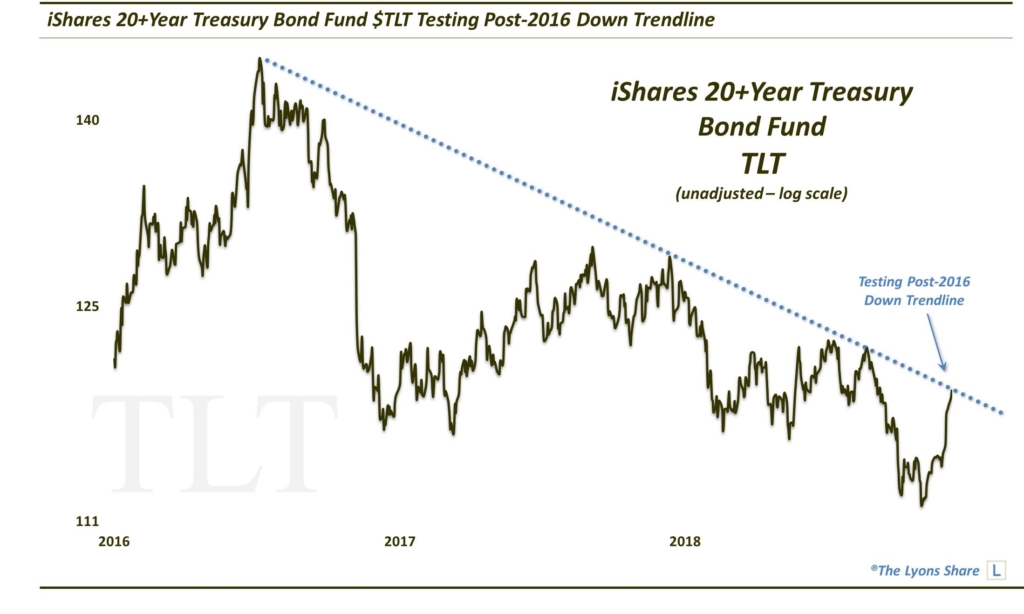
It’s not just equities either. The bond market is also exhibiting some interesting trendline action at the moment. Last week, we looked at the bond yields testing uptrend support. This week, we look at bond prices testing downtrend resistance. Specifically, the popular iShares 20+ Year Treasury Bond ETF (TLT) is testing its post-2016 Down trendline.
Like we suggested last week, “the message behind all of these important tests is that this is likely a critical juncture in the market. If, in the case of the stock indices, the tests are successful, a solid rally may finally take hold after the recent correction. If not, it could be a long way down.”
If you are interested in an “all-access” pass to our charts, research and investment moves, we invite you to further check out The Lyons Share. There, we post all of the noteworthy chart developments for members — EVERY DAY. You can also follow our investment process and posture on a daily basis — including insights into what we’re looking to buy and sell and when. Given what we believe will be a treacherous market climate going forward, there has never been a more important time to reap the benefits of our risk-managed approach. Thanks for reading!
_____________
Disclaimer: JLFMI’s actual investment decisions are based on our proprietary models. The conclusions based on the study in this letter may or may not be consistent with JLFMI’s actual investment posture at any given time. Additionally, the commentary provided here is for informational purposes only and should not be taken as a recommendation to invest in any specific securities or according to any specific methodologies. Proper due diligence should be performed before investing in any investment vehicle. There is a risk of loss involved in all investments.