
Trend Carefully
The numerous important trendline tests currently underway across the financial markets suggest this is a key juncture.
Volatility in global equity markets has kicked back into hyper-drive this week with an average daily true range in the S&P 500 approaching a staggering 3% for the week. The volatility (at least the downside part of it) has resulted in “tests” of a number of important trendlines throughout the financial markets — both in the U.S. and abroad. This proliferation of important tests suggests that we are near an important juncture in the markets. Specifically, as the tests pertain to stocks, it’ll be critical for the various markets to hold their respective uptrend lines. Should they fail here, it could be a long way down to the next significant support levels.
We could have spent all day posting about key trendline tests presently in play. However, as highlighted in our #TrendlineWednesday feature on StockTwits and Twitter, here are some of the most important ones across the financial markets, in the U.S. and abroad.
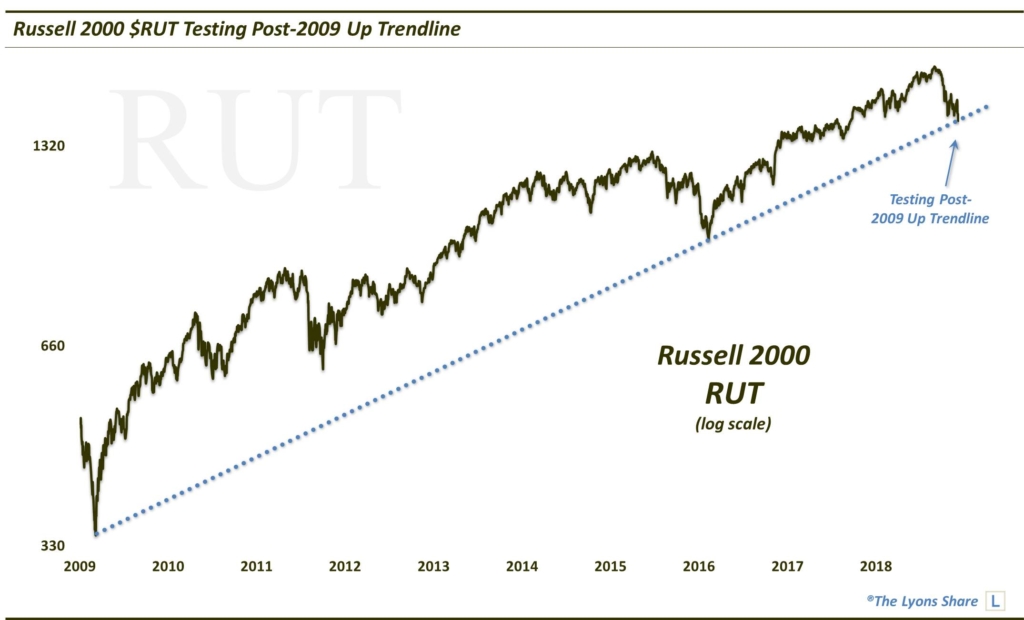
First off, we have the Russell 2000 testing its post-2009 Up trendline.
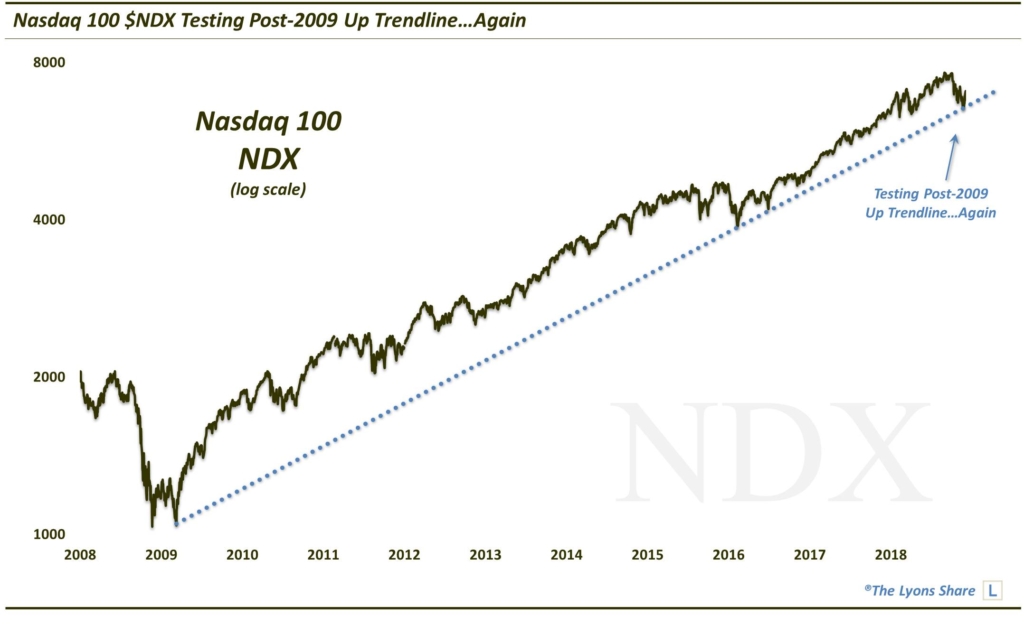
Similarly, the Nasdaq 100 is testing its post-2009 Up trendline that it held last month.
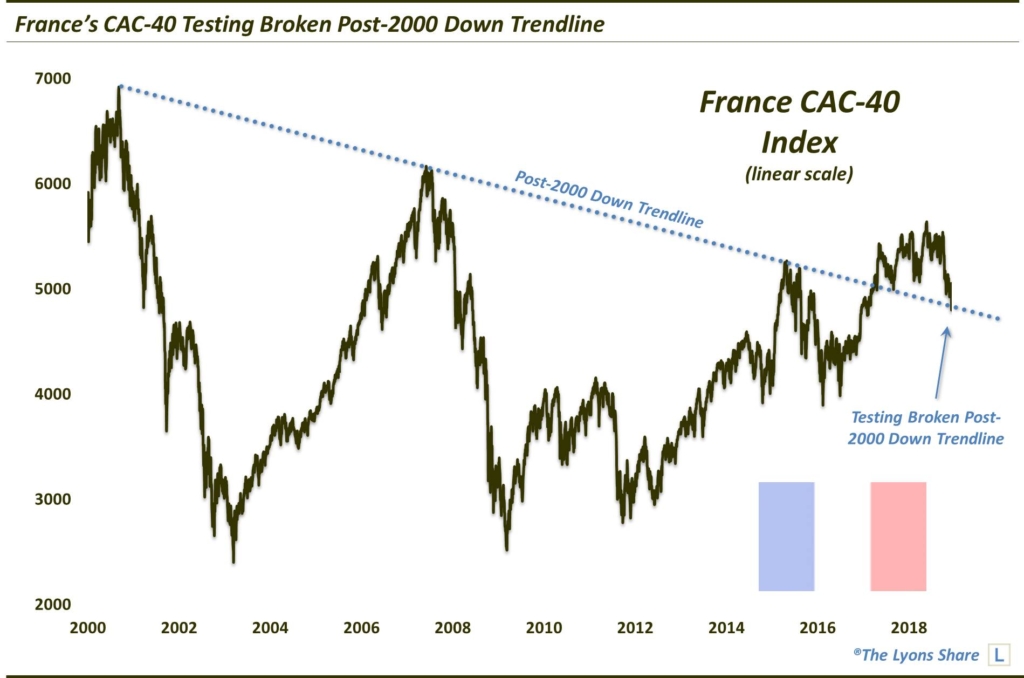
Across the pond, we see perhaps the most prolific trendline in the global stock market universe — the broken post-2000 Down trendline in France’s CAC-40 Index — getting tested at the moment.
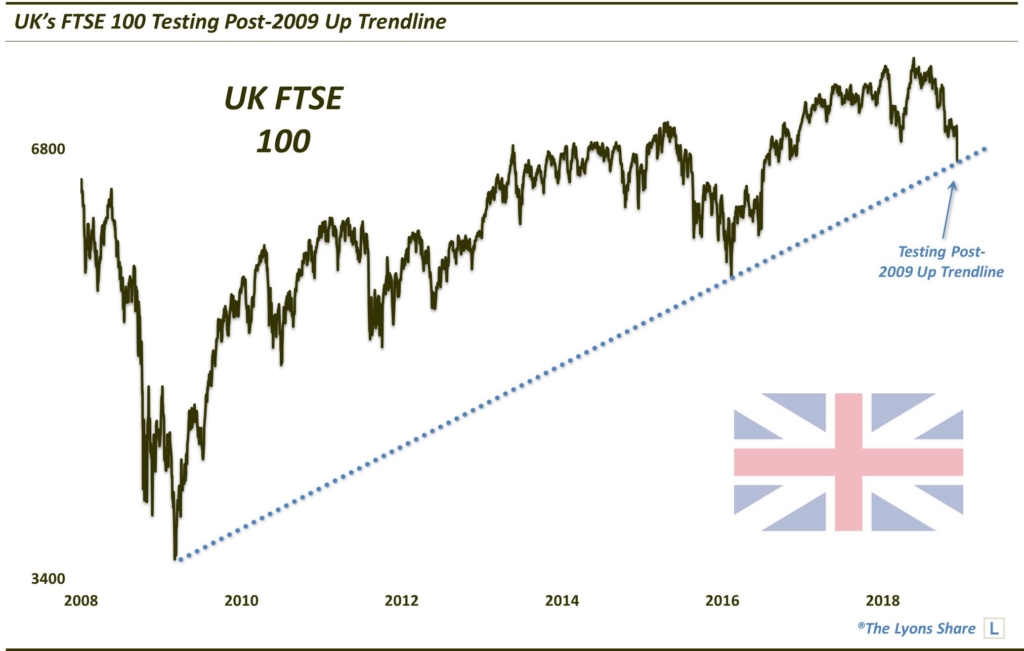
Staying in Europe, we also have the UK’s FTSE 100 testing its post-2009 Up trendline.
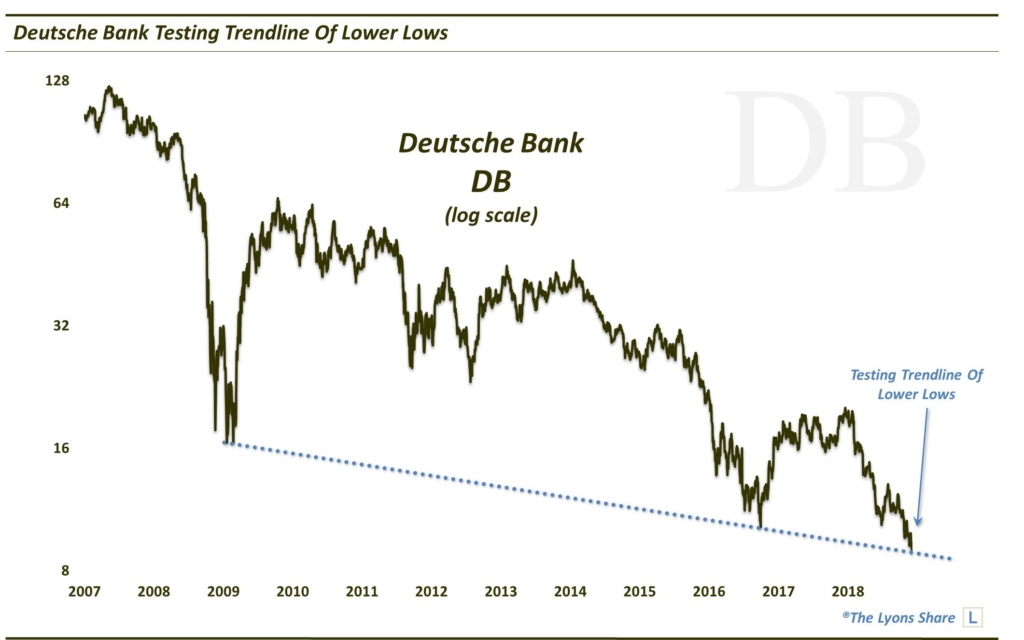
And at perhaps the lowest end of the European equity spectrum, we see Deutsche Bank $DB testing the trendline connecting its series of lower lows over the past decade.
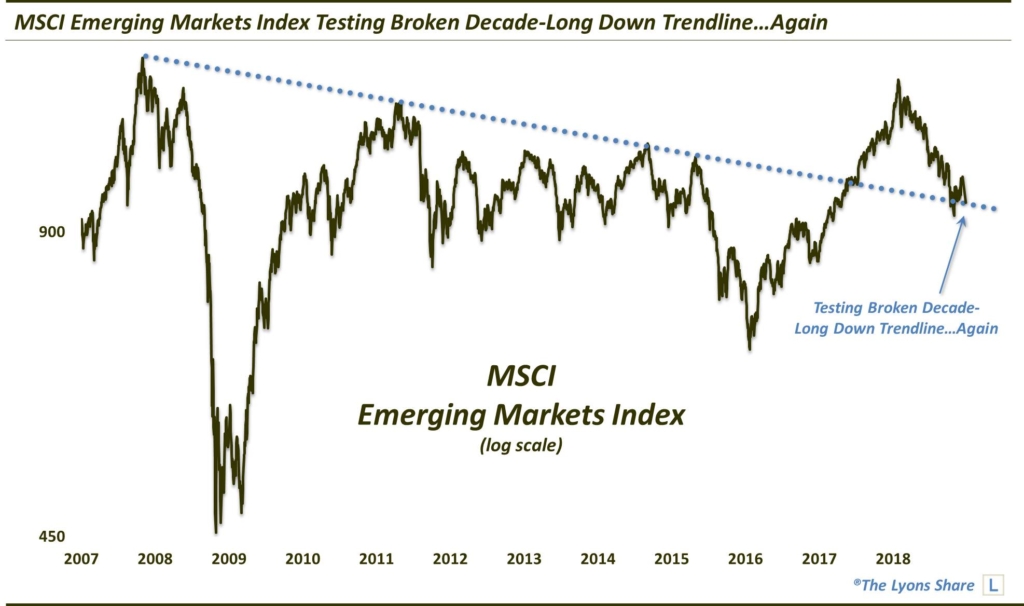
Elsewhere in the world, we see, once again, the MSCI Emerging Markets Index testing its broken decade-long Down trendline.
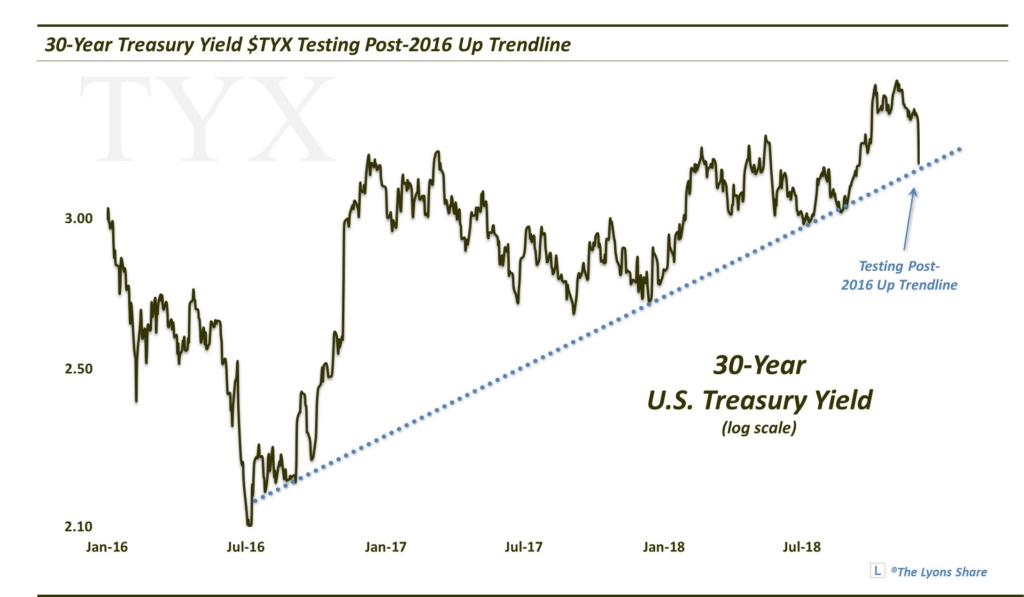
And it’s not just stocks getting having all the trendline fun. We see, among other bond tickers, the 30-Year U.S. Treasury Yield testing its post-2016 Up Trendline.
Like I said, we can go on and on here. I think the message behind all of these important tests is that this is a critical juncture in the market. If, in the case of the stock indices, the tests are successful, a solid rally may finally take hold after the recent correction. If not, like we said, it could be a long way down.
If you are interested in an “all-access” pass to our charts, research and investment moves, we invite you to further check out The Lyons Share. There, we post all of the noteworthy chart developments for members — EVERY DAY. You can also follow our investment process and posture on a daily basis — including insights into what we’re looking to buy and sell and when. Given what we believe will be a treacherous market climate going forward, there has never been a more important time to reap the benefits of our risk-managed approach. Thanks for reading!
_____________
Disclaimer: JLFMI’s actual investment decisions are based on our proprietary models. The conclusions based on the study in this letter may or may not be consistent with JLFMI’s actual investment posture at any given time. Additionally, the commentary provided here is for informational purposes only and should not be taken as a recommendation to invest in any specific securities or according to any specific methodologies. Proper due diligence should be performed before investing in any investment vehicle. There is a risk of loss involved in all investments.


1 Comment