
Was Stock Bounce All Smoke And Mirrors?
Breadth in yesterday’s upside stock reversal was historically thin.
You’ve all seen those circus mirrors — the ones that make a person appear shorter or fatter, etc. than reality? Well, yesterday’s recovery in the stock market (especially the large-caps) after being deep in the hole may too fall into the category of “looks can be deceiving”. In this case, investors should focus on the “thinning” mirrors as market breadth on yesterday’s rebound was historically thin by several measures. Here’s the skinny:
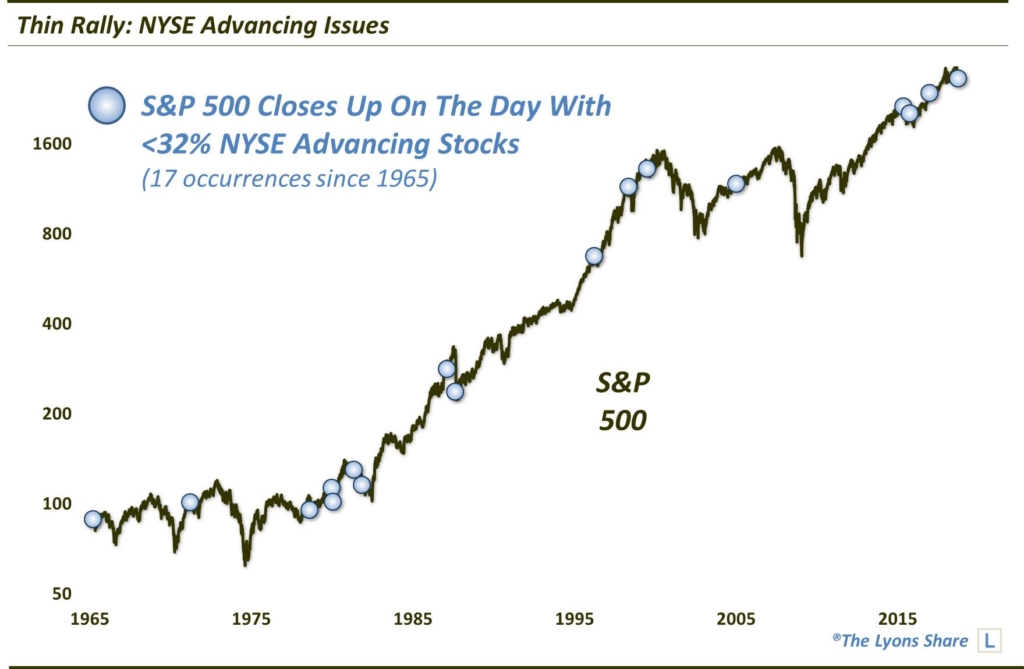
NYSE Advancing Issues
Despite the S&P 500 closing positive on the day (+.18%), the percentage of stocks on the NYSE that advanced on the day was low, historically low. At just 31.5%, it was just the 17th day since 1965 when the S&P 500 rose yet the % NYSE Advancing Issues was <32%.
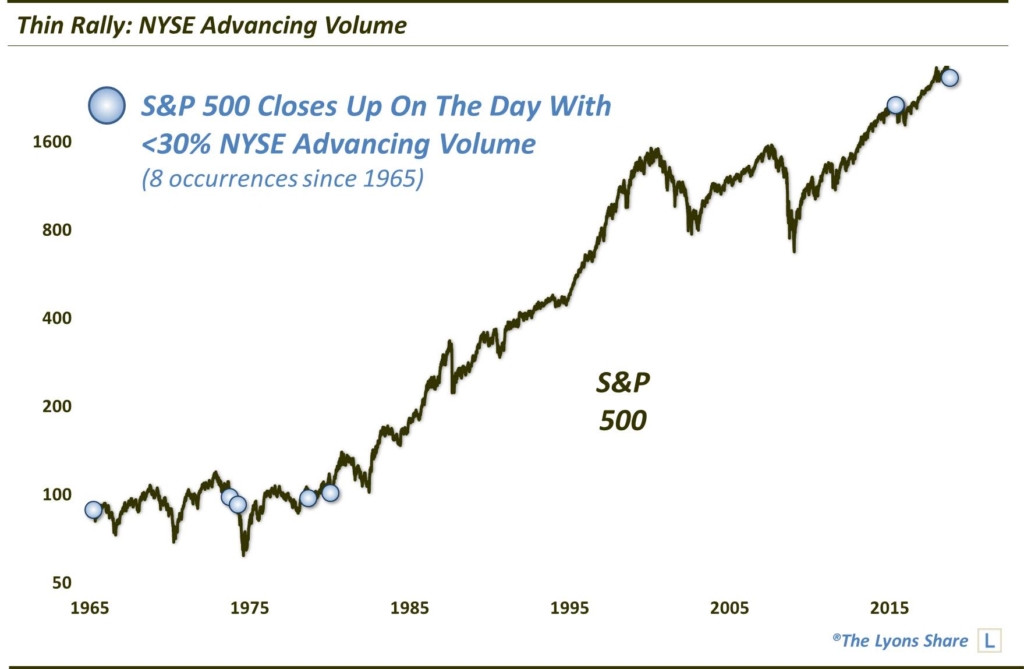
NYSE Advancing Volume
Similarly, the percentage of NYSE Advancing Volume on the day was historically low as well. At just 26.7%, it was the lowest reading since 1980 on a day the S&P 500 rose, the 4th lowest reading since 1965 and just the 8th day <30%.
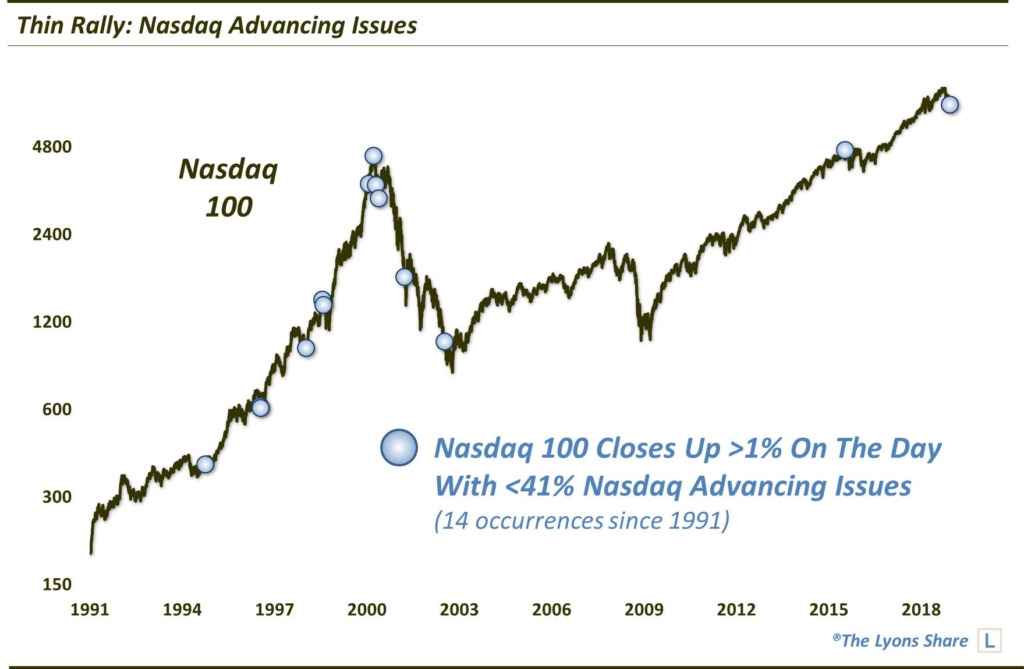
Nasdaq Advancing Issues
Not to be outdone, the Nasdaq market also exhibited very thin internals despite the rebound — especially considering the Nasdaq 100 closed up more than 1% on the day (+1.05%). In fact, the percentage of stocks on the Nasdaq that Advanced on the day was just 40.5%, marking just the 14th day since 1991 when the Nasdaq 100 jumped by more than 1%, yet the % Nasdaq Advancing Issues was <41%.
So what’s the upshot to all of this? Well, we could get all quantitative and look at the historical data (just kidding…we already did, of course! We’ll share with TLS members probably in tomorrow AM’s Strategy Session). But the main point is that, at best, this is a one-off, quirky event wherein breadth either hasn’t had a chance to catch up with the indices, or is merely the irrelevant byproduct of a strange day on the Street. At worst, though, it is another manifestation of the thinning internal market structure and lack of substantial risk-taking inclination on the part of investors.
If you are interested in an “all-access” pass to our charts, research and investment moves, we invite you to further check out The Lyons Share. There, we post all of the noteworthy chart developments for members — EVERY DAY. You can also follow our investment process and posture on a daily basis — including insights into what we’re looking to buy and sell and when. Given what we believe will be a treacherous market climate going forward, there has never been a more important time to reap the benefits of our risk-managed approach. Thanks for reading!
_____________
Disclaimer: JLFMI’s actual investment decisions are based on our proprietary models. The conclusions based on the study in this letter may or may not be consistent with JLFMI’s actual investment posture at any given time. Additionally, the commentary provided here is for informational purposes only and should not be taken as a recommendation to invest in any specific securities or according to any specific methodologies. Proper due diligence should be performed before investing in any investment vehicle. There is a risk of loss involved in all investments.


