
Bad AAPL (PREMIUM-UNLOCKED)
The following post was initially issued to TLS subscribers on January 3 following Apple’s earnings warning and subsequent stock plunge.
The stock of Apple is getting pummeled; how far down could it go — and what are the key levels to watch?
The stock market’s rally off of our “once a decade” support levels continued on the first day of of the new year yesterday. Despite a large gap down to start the day, stocks recovered to close positive. For the rally to continue on day 2 of 2019, they will have to overcome another large gap down at the open. The culprit is Apple following its earnings warning.
Let’s cut to the chase — how far down might Apple drop? What are the key levels? For starters, we are not surprised to see the stock gap down to where it did…and stop. That’s because, as we discussed in today’s Daily Strategy Session, the ~$143-$144 level contains a confluence of key Fibonacci Retracements, including:
- The 38.2% Fibonacci Retracement of the 2009-2018 Rally
- The 50% Fibonacci Retracement of the 2013-2018 Rally
- The 61.8% Fibonacci Retracement of the 2016-2018 Rally
- The 78.6% Fibonacci Retracement of the Rally from the 2017 Breakout
- 1000-Day (200-Week) Simple Moving Average (not shown)
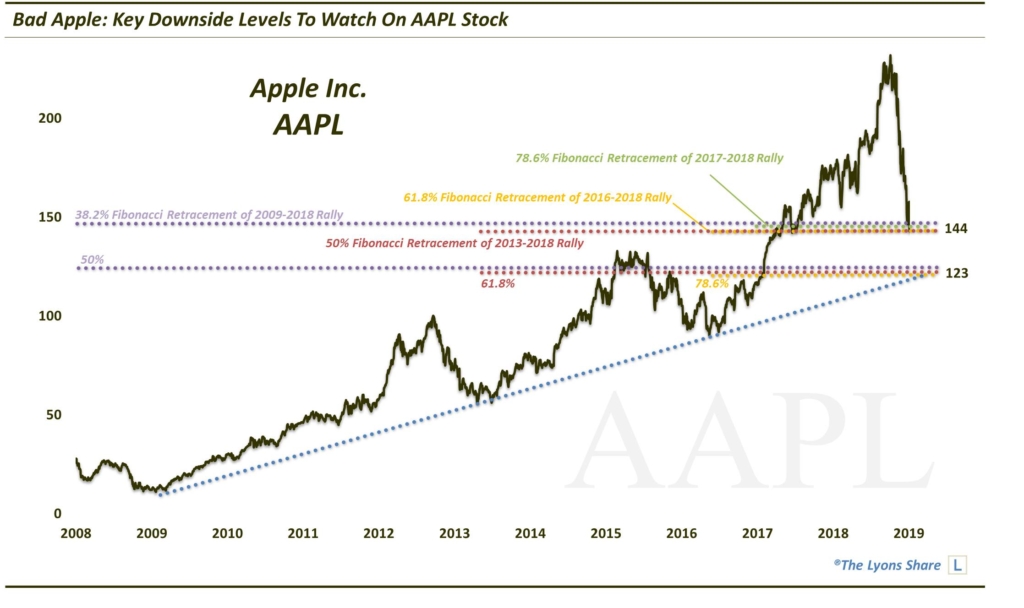
Some small leeway (i.e., a few points) below should be granted given the volatility. So a few days may be required to let things shake out. Should this level get decisively taken out, however, the next level to target on the downside is ~$121-$123. Key levels there include:
- The 50% Fibonacci Retracement of the 2009-2018 Rally
- The 61.8% Fibonacci Retracement of the 2013-2018 Rally
- The 78.6% Fibonacci Retracement of the 2016-2018 Rally
- The Gap Up from the 2017 Breakout
- Potentially the Post-2009 Up Trendline
Indeed, given the importance of the layers there, as well as the longer-term bear market we expect is underway, we would expect that eventually AAPL gets down to that lower level. However, perhaps not before a bounce attempt from current prices near $143, as unlikely as that seems in the midst of the current onslaught.
As always, stay tuned to the Daily Strategy Sessions for further updates.
If you are interested in an “all-access” pass to our research and investment moves, we invite you to further check out The Lyons Share. Considering the treacherous market climate we envision for some time, there has never been a better time to reap the benefits of our risk-managed approach. Thanks for reading!
_____________
Disclaimer: JLFMI’s actual investment decisions are based on our proprietary models. The conclusions based on the study in this letter may or may not be consistent with JLFMI’s actual investment posture at any given time. Additionally, the commentary provided here is for informational purposes only and should not be taken as a recommendation to invest in any specific securities or according to any specific methodologies. Proper due diligence should be performed before investing in any investment vehicle. There is a risk of loss involved in all investments.


