Is Advance-Decline Signal Really “Infallible”? (UNLOCKED-PREMIUM)
This is a free look at the type of original research pieces we produce for our members at The Lyons Share.
Does the return to new highs in the NYSE Advance-Decline Line mean new highs in the S&P 500 are on the way as well?
We have mentioned plenty of times in the past that we are strong proponents of broad participation when considering our equity allocation. As such, we put a lot of stock (no pun intended) into the behavior of broad indices or metrics as they can be reliable indicators of the health of the overall market. One such example is the NYSE Advance-Decline Line (A-D Line).
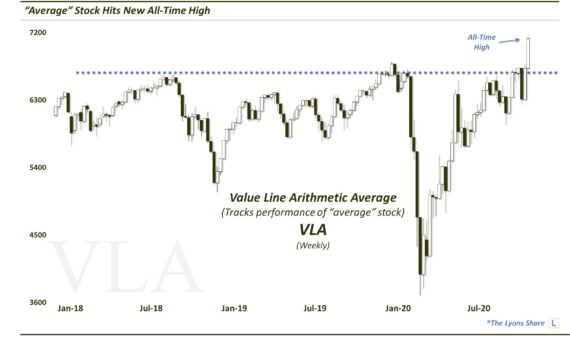
The A-D Line is a cumulative running tally of the daily difference between advancing issues and declining issue on the NYSE. When the A-D Line is rising at a solid pace, it is typically supportive of a continued rise in the overall stock market, particularly when it is hitting all-time, or at least 52-week, highs. Well, after getting bludgeoned in the 4th quarter of 2018, the A-D Line has led the stock rebound in 2019. In fact, in the past few days, with great fanfare among the media and social media ranks, the A-D Line has found its way back to all-time high ground once again.
The way that the A-D Line has led the post-December rally has been interesting indeed. Consider, for example, that one would be hard pressed to find any popular stock indices that are themselves back at new highs. Now, it is certainly not unprecedented for the A-D Line to register new highs while the major averages are below theirs. However, the extent to which the indices are lagging their former highs is a bit unusual.
For example, when the A-D Line finally made it back to new highs a few days ago, the S&P 500 was still more than 6% below its 52-week high. Over the past 50 years, the magnitude of that deficit has only been seen a handful of unique times.
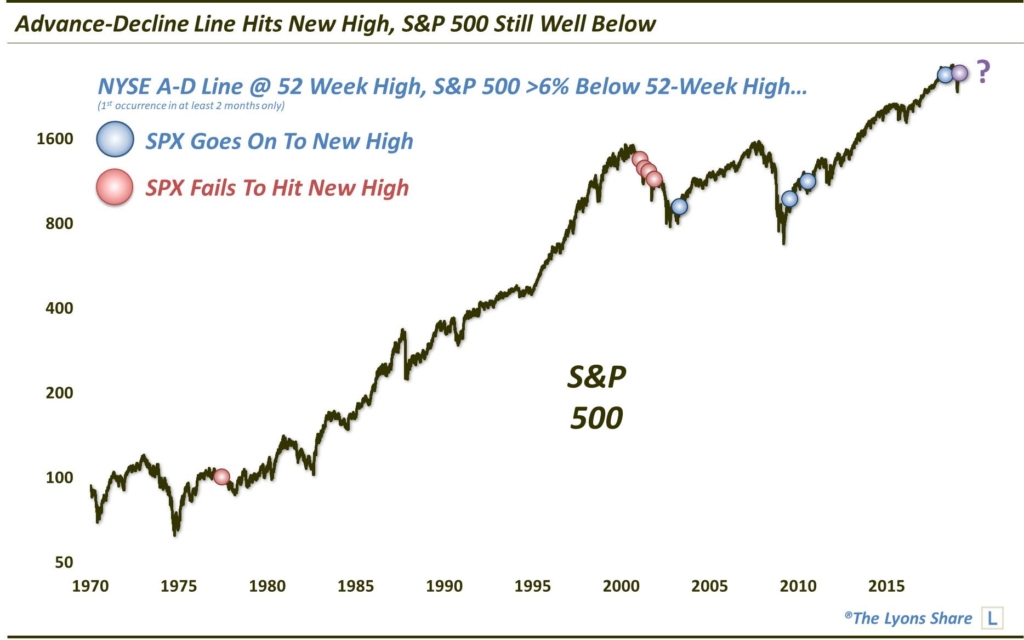
In reading commentary regarding the new high in the A-D Line, the common message is the positive implication for the continuation of the rally. Specifically, the widespread conclusion among commentators seems to be the inevitability of a forthcoming new high in the S&P 500 as well. Looking at the precedents on the chart, we’re not so sure that historical evidence would support that as an inevitable outcome.
That’s because, of the 9 prior such unique occurrences (i.e., not within 2 months of another reading), 4 saw the S&P 500 go on to make a new high — while 5 did not.
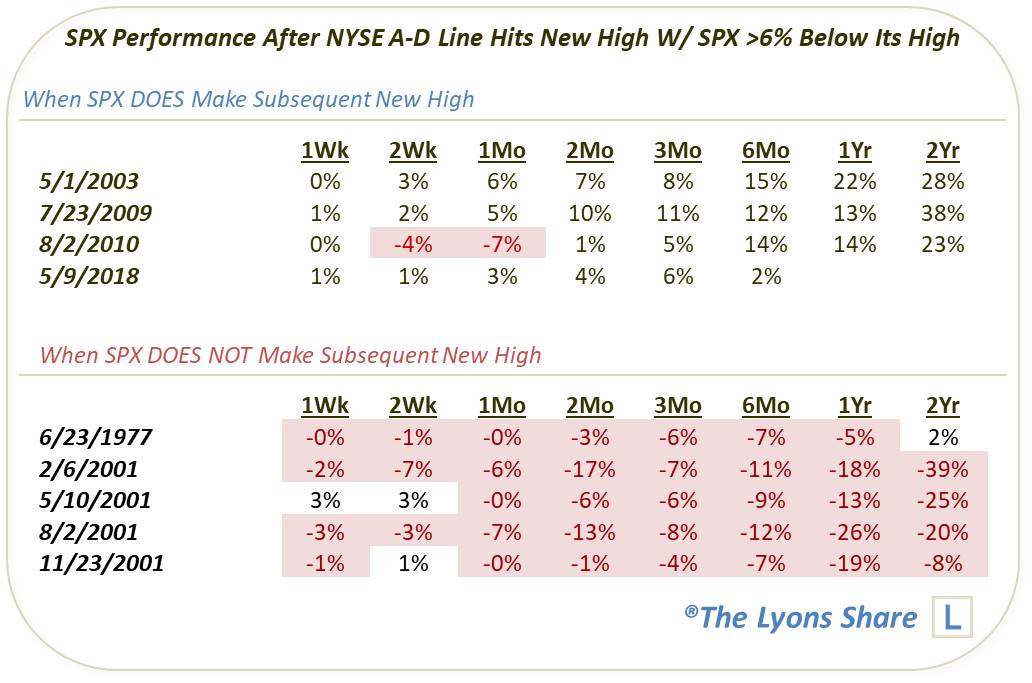
So, historically, the new high in the A-D Line hardly has an infallible track record of lifting the SPX out of a deep hole and into new high ground. But into which category will our present example fall?
To the extent that we can use the historical precedents as guides (a somewhat dubious proposition), there are problematic comparisons with each category. For example, the 2003, 2009 and 2010 instances that led to new highs occurred following major cyclical bear market lows. Thus, there was arguably a stronger cyclical tailwind behind those markets. On the flip side, the 1977 and 2001 episodes that failed to lead to new S&P 500 highs did not occur during rallies of the same level of vigor as the present one. Thus, they did not carry the same amount of momentum as our current rally and were perhaps more easily thwarted.
Perhaps the best comparison was the most recent occurrence last spring. Similar to now, the market was in the midst of a nice rally, though, it was not coming off of any major, longer-term low. Of course, the S&P 500 would go on to new highs, but would struggle immediately thereafter. And presently, it is below its level of 9 months ago.
In short, there may be little in the way of comparative value when looking at the historical precedents. All we can really say is that, at times, new highs in the NYSE A-D Line preceded eventual rallies in the S&P 500 from deep deficits to new high ground — and at other times, they did not. We’re not going to argue that the new A-D Line high is a negative in any way. However, just know that, unlike the cocksure conclusions you may be reading elsewhere that new a SPX high is inevitable — nothing is guaranteed.
If you’re interested in the “all-access” version of our charts and research, please check out our site, The Lyons Share. You can follow our investment process and posture every day — including insights into what we’re looking to buy and sell and when. Plus, our LAUNCH ANNIVERSARY SALE (33% OFF!!) is going on now so it’s a great time to sign up! Thanks for reading!
_____________
Disclaimer: JLFMI’s actual investment decisions are based on our proprietary models. The conclusions based on the study in this letter may or may not be consistent with JLFMI’s actual investment posture at any given time. Additionally, the commentary provided here is for informational purposes only and should not be taken as a recommendation to invest in any specific securities or according to any specific methodologies. Proper due diligence should be performed before investing in any investment vehicle. There is a risk of loss involved in all investments.