Is That It For The DIP? (PREMIUM-UNLOCKED)
The following is a free look at an example of the research we provide TLS members daily along with chart analysis on indices and securities.
The volatility market gave a head’s up ahead of the recent stock market dip — but has the dip run its course…or is there more to come?
Stocks got out of the gate like gangbusters again to begin last week. Well, at least the Nasdaq did. Specifically, the Nasdaq 100 (NDX) rose each of the 1st 4 days of the week to the tune of more than 2.5%. As we alerted TLS members at the time, however, the volatility market was not necessarily buying that strength. The Nasdaq 100 Volatility Index (VXN), for example, which typically would drop in the face of NDX strength, was actually higher by about 10% those first 4 days. That got our antennae up.
We’ve looked several times in the past at like junctures when stocks and volatility expectations diverged similarly. By diverged, we mean diverged from the typical behavior — they actually moved in the same direction (higher in this case). And what we found was that, more times than not, the volatility market actually had it right. That is, stocks struggled to make further significant upside in the near-term. We saw that again last week as the NDX dropped 2.2% of Friday, nearly wiping out the entire gain to begin the week.
But is that it for the NDX dip? Has the warning signaled by the volatility market run its course? We can’t obviously see the future, but if we look at similar divergences from the past, there was often further damage to come.
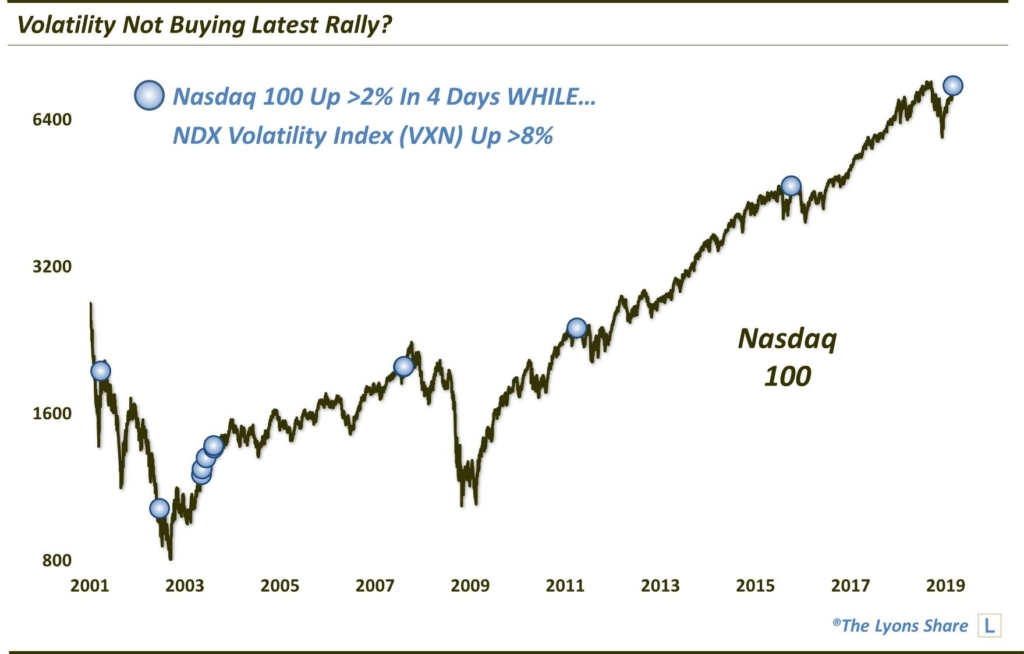
For example, this chart shows each of the occasions since the inception of the VXN when the NDX rose at least 2% over a 4-day span while the VXN gained at least 8%.

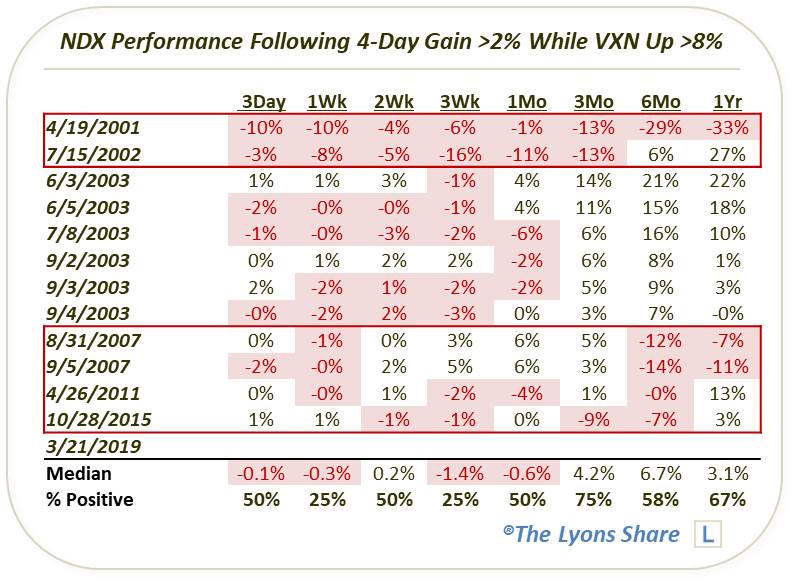
From eye-balling the chart, we see that of the relatively few such incidents in the past, several occurred near intermediate-term tops of note, including events in 2001, 2002, 2007, 2011 and 2015. There were a handful of occurrences in 2003 that did not lead to anything too damaging in the long-term. However, in the table below, we see that even those occasions saw the NDX struggle over the subsequent 3-week to 1-month period.

This does not guarantee that the recent dip hasn’t run its course. Indeed, today’s bounce is a step back in the bullish direction. However, if history is any guide (always a big “if”), the potential for a “double dip” may not be out of the question.
If you are interested in an “all-access” pass to our research and investment moves, we invite you to further check out The Lyons Share. Given a treacherous emerging market climate, there has never been a better time to reap the benefits of our risk-managed approach. Thanks for reading!
_____________
Disclaimer: JLFMI’s actual investment decisions are based on our proprietary models. The conclusions based on the study in this letter may or may not be consistent with JLFMI’s actual investment posture at any given time. Additionally, the commentary provided here is for informational purposes only and should not be taken as a recommendation to invest in any specific securities or according to any specific methodologies. Proper due diligence should be performed before investing in any investment vehicle. There is a risk of loss involved in all investments.


