
Nasdaq New High A Little Thin? (UNLOCKED-PREMIUM)
The Nasdaq 100 has made it back to all-time highs again — but with more New Lows than New Highs; is that a red flag?
The Nasdaq 100 was officially the first major average to make it back to new high ground as it surpassed its 2018 peak over the past few days. While that is certainly bullish news, the nature of the new high may be less than optimum — at least if history is any indication. That’s because the new high in the NDX index was accompanied by a relatively thin number of individual stock new highs.
Specifically, despite the NDX new highs on 4/18 and 4/22, there were actually more stocks hitting New 52-Week Lows on the Nasdaq exchange than New Highs. While that may or may not impress you, it is historically noteworthy, based on the rarity of the occurrence alone. Of the 778 52-week highs in the Nasdaq 100 since 1990, this was just the 18th and 19th occurring with more New Lows than New Highs.
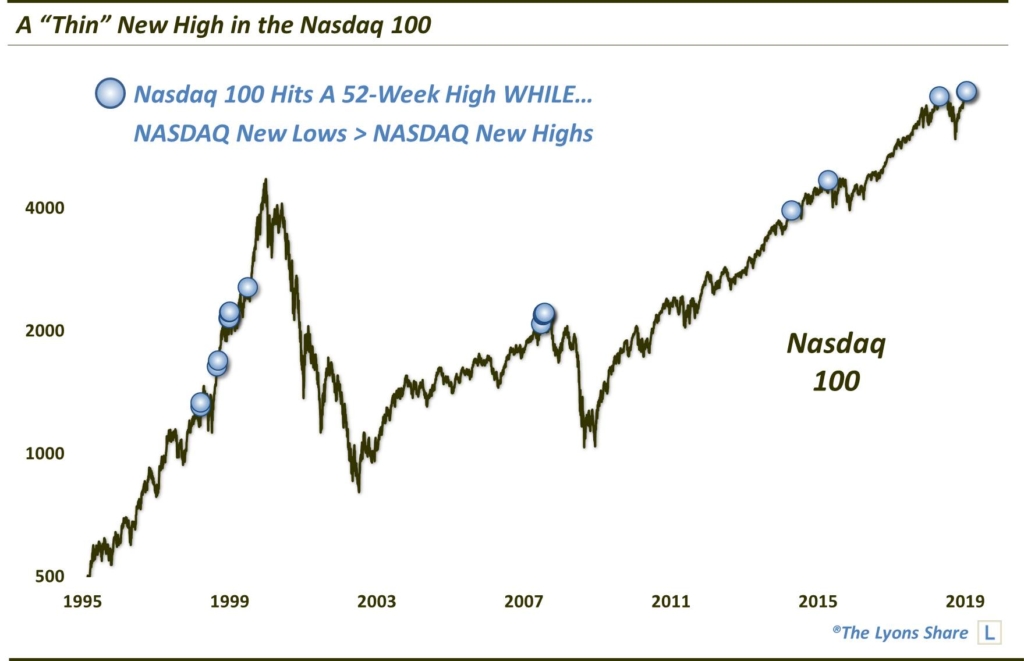
As you can see in the chart, several of the previous 18 occurrences took place in close proximity to intermediate-term, or even cyclical, market tops (e.g., 1998, 2007, 2015, 2018). That said, not all events led to immediate disaster. Specifically, the 1999 events saw the index continue on to further, extensive new “bubbly” heights.
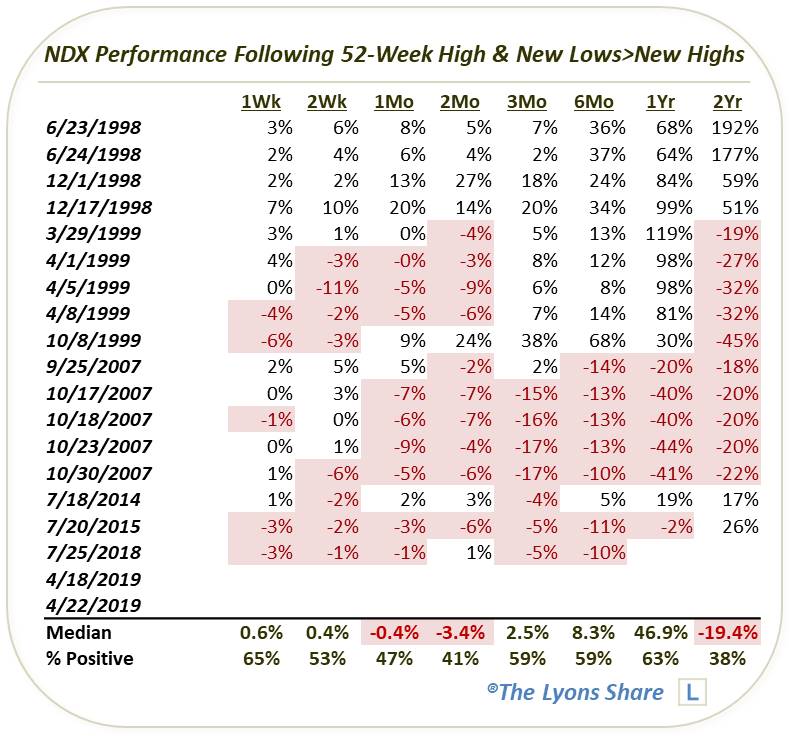
Here are the actual returns following the previous events. As you can see, it has more or less been feast or famine for this signal, historically.
Since cap-weighted and top-heavy indices like the NDX can, and have, seen rallies persist further under such conditions in the past (e.g., 1999), we thought it would be interesting to plot the events on a broader market index which might be more impacted from narrowing breadth situations. Here are the dates plotted on one of our favorite broad indices, the Value Line Geometric Composite (VLG), which tracks the performance of the “median stock” in the market.
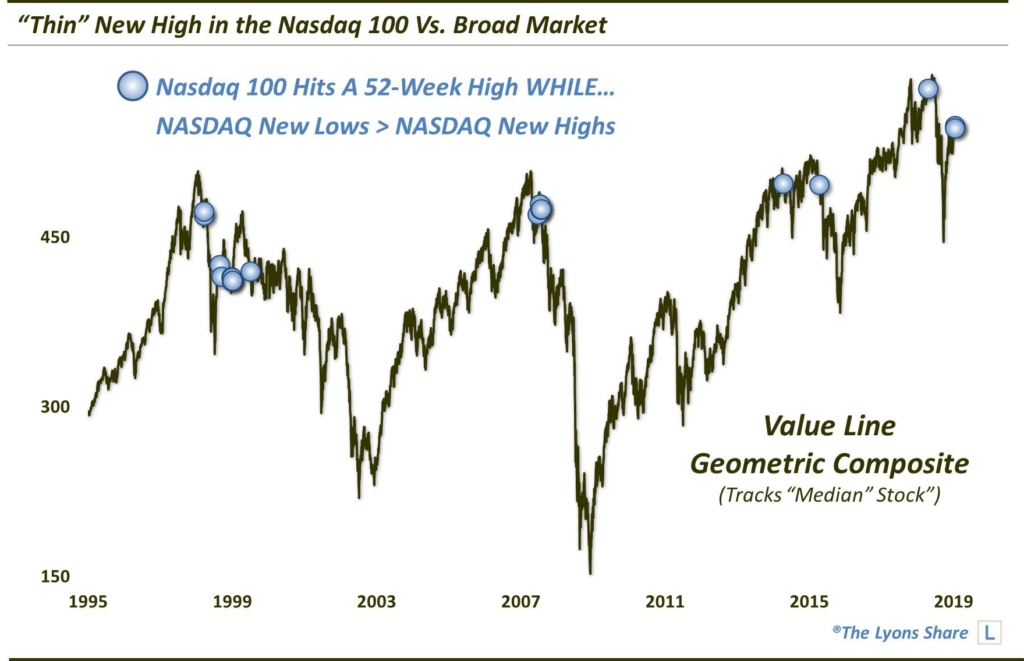
As you can see, the VLG was much less apt to continue higher for very long following these signals. In fact, in most cases, the VLG had already topped for the cycle and was either declining or establishing a lower high, indicative of a weakening breadth situation.
Here are the returns in the VLG following these historical events.
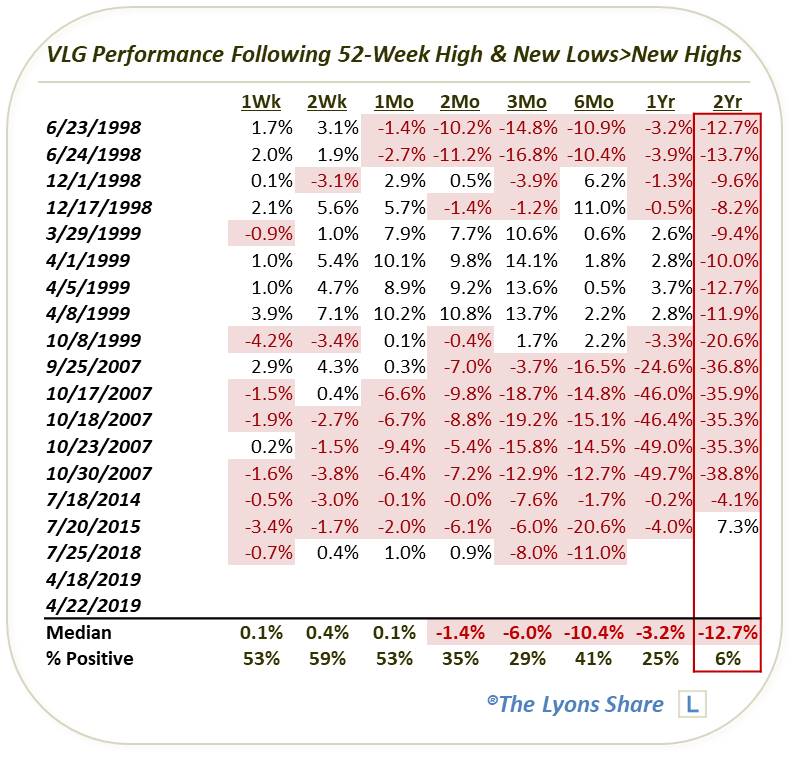
Is this a signal to start running for the hills? Not necessarily. It is but one data point and doesn’t, in our view, outweigh the positives that we still see in the market currently. However, we would be remiss, given the nearly unanimously weak 2-year post-event returns in the VLG, to completely dismiss this development. New highs in the indices may be back, but the air up here is a bit thinner than we would prefer.
If you are interested in an “all-access” pass to our research and investment moves every day, we invite you to further check out The Lyons Share. Given a potentially emerging treacherous market climate, there has never been a better time to reap the benefits of our risk-managed approach. Thanks for reading!
_____________
Disclaimer: JLFMI’s actual investment decisions are based on our proprietary models. The conclusions based on the study in this letter may or may not be consistent with JLFMI’s actual investment posture at any given time. Additionally, the commentary provided here is for informational purposes only and should not be taken as a recommendation to invest in any specific securities or according to any specific methodologies. Proper due diligence should be performed before investing in any investment vehicle. There is a risk of loss involved in all investments.


