
The “Junkie Market” Is Back (PREMIUM-UNLOCKED)
While stock averages are back at all-time highs, a corresponding abundance of New Highs AND New Lows may be sending a warning.
We’ve written several times in the past regarding what we call a “junkie market”. By that, we are referring to a market with an inordinate number of both New 52-Week Highs AND 52-Week Lows. What we have observed is that often when we see such a phenomenon while the stock indices are themselves at a 52-week high, it can be an inauspicious time to remain invested in the market. That may be a foreboding signal for investors right now as such circumstances are currently present on the Nasdaq exchange.
Specifically, while the Nasdaq 100 (NDX) has traded at new all-time highs in recent days, there has been a relative abundance of both New Highs AND New Lows (over 100, to be exact) on the Nasdaq exchange. In the past 20 years, this combination has signaled longer-term trouble for stocks.
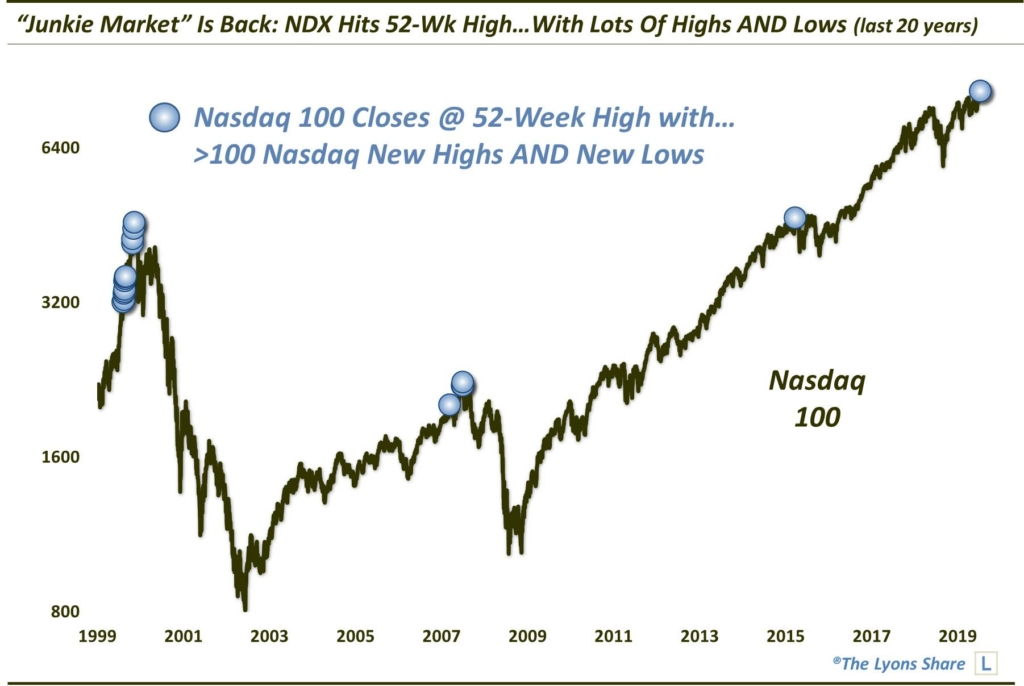
As the chart shows, this is the first time since the July 2015 top that we have observed such conditions. Of course, that signal preceded a 19% drop in the NDX. And in fact, in the past 20 years, the only other instances of these conditions also occurred at or near major tops — specifically the 2000 and 2007 cyclical tops. I probably don’t have to remind anyone that those signals were followed by NDX declines of 82% and 54%, respectively.
We will note that the only other historical instances took place during the mid-1990′s while the NDX was in the midst of its seemingly interminable ascent leading up to its 2000 bubble top.

Obviously, these occurrences failed to thwart the rally any time soon. Although, we will mention that the majority of stocks were generally moving lower from 1998 to 2000 (which would account for the elevated New Lows). So not all pockets of the market were safe during this time.
So which type of market are we in – the mid-1990′s parabolic rise, or the post-2000 environment when this signal was a guaranteed death knell?
Well, as you know, our analysis points to a very bleak picture for the market in the longer-term. Specifically, while some folks may find it difficult to fathom, we believe that the secular bear market that began in 2000 is actually still in effect. Yes, many of the markets broke to new highs back in 2013. However, we still believe that the sustainability of the gains since will eventually come into question. At least a test of those former highs from 2000 and 2007 is not out of the question.
Therefore, we would tend to lean on the post-2000 period in the charts above as our guide as opposed to the mid-1990’s period. Considering the prevailing longer-term market and economic excesses, it is very doubtful that this market will embark on a parabolic ascent like we saw back then.
Now, can the market continue higher in the near-term? Certainly it can, and our intermediate-term Risk Model is still positively positioned. Even if these “Junkie Market” occurrences are foreshadowing the eventual end of the road for the bull market, further near-term gains are not out of the question. For example, the market rallied for months after the initial signals in late-1999 to early-2000 before the bubble burst. Even in 2007, the first signal in July preceded another rally to subsequent signals — and the eventual top — in October.
Therefore, despite the presence of this signal, further near-term gains cannot be ruled out. However, when we forecast the breakout, and that it would likely be unsustainable, it was predicated on the data being unconfirming and unsupportive of a sustainable new up-leg. Now that we have gotten the breakout, initial signs are validating our thesis. The elevated number of New Lows along with the New Highs is one piece of evidence of a seriously flawed breakout — and one that will likely be vulnerable to failing.
Therefore, like the past several times that we witnessed the presence of a Junkie Market, we consider it to be a negative for the stock market’s prospects going forward — and a quite serious negative at that.
_____________
Disclaimer: JLFMI’s actual investment decisions are based on our proprietary models. The conclusions based on the study in this letter may or may not be consistent with JLFMI’s actual investment posture at any given time. Additionally, the commentary provided here is for informational purposes only and should not be taken as a recommendation to invest in any specific securities or according to any specific methodologies. Proper due diligence should be performed before investing in any investment vehicle. There is a risk of loss involved in all investments.


