
VIX Rises Even As Stocks Hit New Highs
This is the third in a mini-series look at some unusual behavior we’re observing in the S&P 500 Volatility Index, aka, the VIX (on 11/19, we looked at the VIX’s historic streak without hitting a 52-week low and on 11/20, we looked at the abundance of 52-week highs in the S&P 500 since the last VIX low).
The S&P 500 has recorded a flurry of 52-week highs recently, many of which oddly saw the VIX rise as well; is this behavior sending a message to investors?
As we mentioned the other day, when stocks move higher, the S&P 500 Volatility Index, aka, the VIX, generally moves lower. That relationship doesn’t always hold, however, and we have seen an extreme example of counter behavior just recently.
Since its recent breakout, the S&P 500 (SPX) has put up a spree of new 52-week highs – 10 of them, in fact, in the past month. Of those 10, 6 of them also saw the VIX close higher on the day. As our Chart Of The Day illustrates, that’s one of the largest clusters of such events in the history of the VIX.
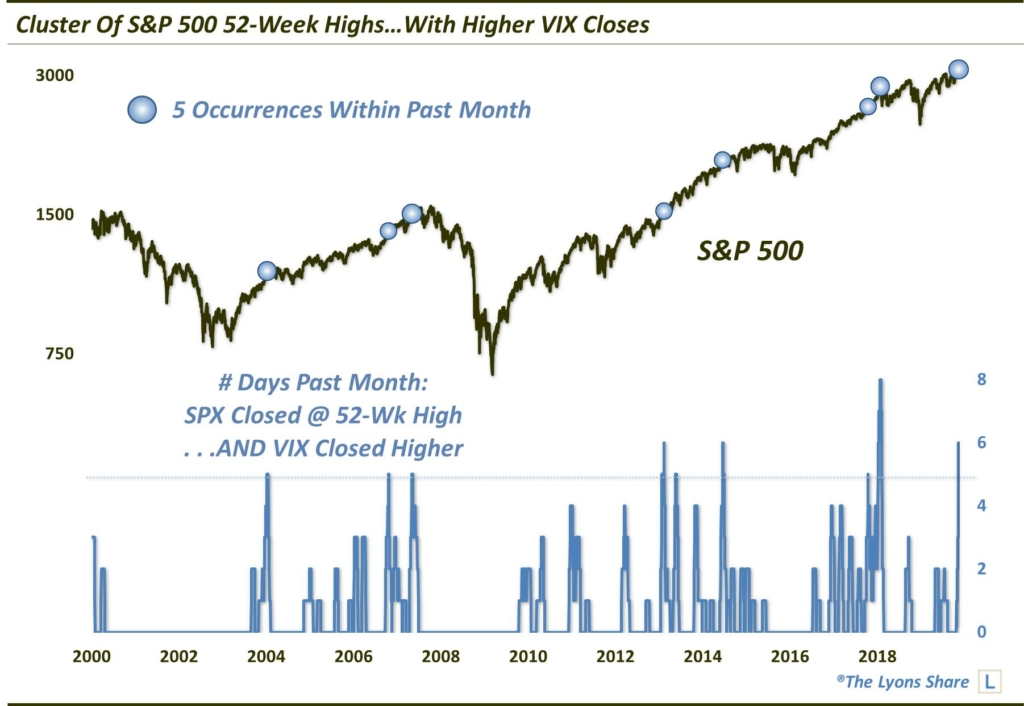
As the chart indicates, it has been relatively rare to see even clusters of 5 such days over the past 20 years. But is there a message behind this data point? Further, is the message a cautionary one?
Well, it is worth noting that the last cluster of events this large (actually, a record 8-day cluster) occurred right at the January 2018 top in the S&P 500. Prior to that, we also observe a similar cluster in May 2007 which essentially marked the top of the broad U.S. stock market for about the next 6 years.
With that said, there have also been as many clusters in the past 20 years that did not led to tumultuous stock market performance. Furthermore, it’s not shown on this chart, but the rising stock-rising volatility period during the mid to late-1990′s also saw several such clusters. And outside of one prior to the sharp 1998 correction, they did not precede anything too worrisome in the stock market either.
So what’s the takeaway here? The historical evidence is a mixed bag, more so than the prior signals we’ve looked at in this VIX series. It is something to be aware of. However, it certainly isn’t going to supersede our quantitative models in generating investment decisions for us (nothing does).
Want to know what our models are telling us now – and how we are investing as a result? We invite you to check out The Lyons Share, a daily “all-access” pass to our research and investment moves. Given what is shaping up as perhaps the most volatile and opportunistic market juncture of the past decade – across all asset classes – there has never been a better time to reap the benefits of our risk-managed approach. Furthermore, TLS will be holding its biggest sale of the year (the Black Friday Sale) shortly. If you’d like to get an early bird jump on the sale, email us at info@jlfmi.com and we’ll be happy to accommodate you. Thanks for reading!
_____________
Disclaimer: JLFMI’s actual investment decisions are based on our proprietary models. The conclusions based on the study in this letter may or may not be consistent with JLFMI’s actual investment posture at any given time. Additionally, the commentary provided here is for informational purposes only and should not be taken as a recommendation to invest in any specific securities or according to any specific methodologies. Proper due diligence should be performed before investing in any investment vehicle. There is a risk of loss involved in all investments.

