
The Golden Corral? (PREMIUM-UNLOCKED)
The following post was originally issued to TLS members on January 8, 2020.
Stampeding gold prices may be constrained at nearby levels — for now.
As members know, we are all about investing with the prevailing trend. For that reason, we have been bullish on gold (…and gold miners…and silver) for the past 6-7 months. Members also know that we don’t like to necessarily set targets on our positions. Rather, we prefer to let them run until they demonstrate compelling evidence that their uptrend is over. That said, we are not averse to booking some profits when prices reach what we consider to be significant potential resistance levels. Gold prices have reached such levels.
Looking at London Gold prices, what would we consider to be “significant” resistance? Obviously, the most significant is the 2011 cyclical high set near 1900 dollars. Besides that, the 2 most significant levels of resistance, in our view, are the following:
- The 61.8% Fibonacci Retracement of the 2011-2015 Decline
- The 2013 multi-year breakdown that led to further (at times, waterfall) declines over the subsequent 2.5 years
As it happens, both of these points lie at approximately the 1575 level. London Gold closed yesterday at 1576.
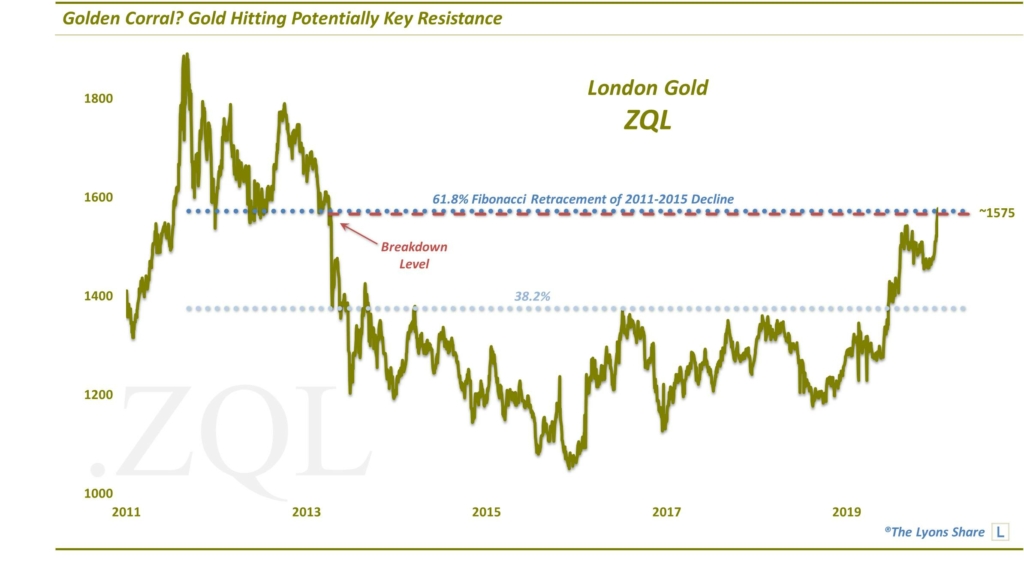
Giving us further confidence in the importance of this level, at least from the Fibonacci standpoint, is that the 3rd most significant resistance on the chart was the 38.2% Fibonacci Retracement of the 2011-2015 decline. As the chart indicates, that level held as resistance (with several precise peaks) from late 2013 until it was broken in mid-2019.
Now, last night following the Iranian retaliatory missile strikes, gold spiked up to over 1600. It’s not unusual to see a slight overshoot of such an important level — not to mention some margin of error must be allowed for on a decade-long chart. That overshoot, in fact, makes the level even that more significant and compelling as resistance — given that gold prices have completely lost their overnight gains and are now lower on the day. Such an emotional blow-off is the final kicker that should convince us that this may be an important top — at least, temporarily — and that pocketing some profits (i.e., selling some longs) is the prudent course of action from a risk management standpoint.
As you know, we trade ETF’s for our managed clients. Therefore, the SPDR Gold Shares (GLD) has been the gold investment vehicle of choice for us this year. Looking at its chart, we see predominately the same story as Gold. Namely, A) the 61.8% Fibonacci Retracement of the 2011-2015 Decline and B) the 2013 multi-year breakdown lie in the same vicinity of each other — between 148-153.
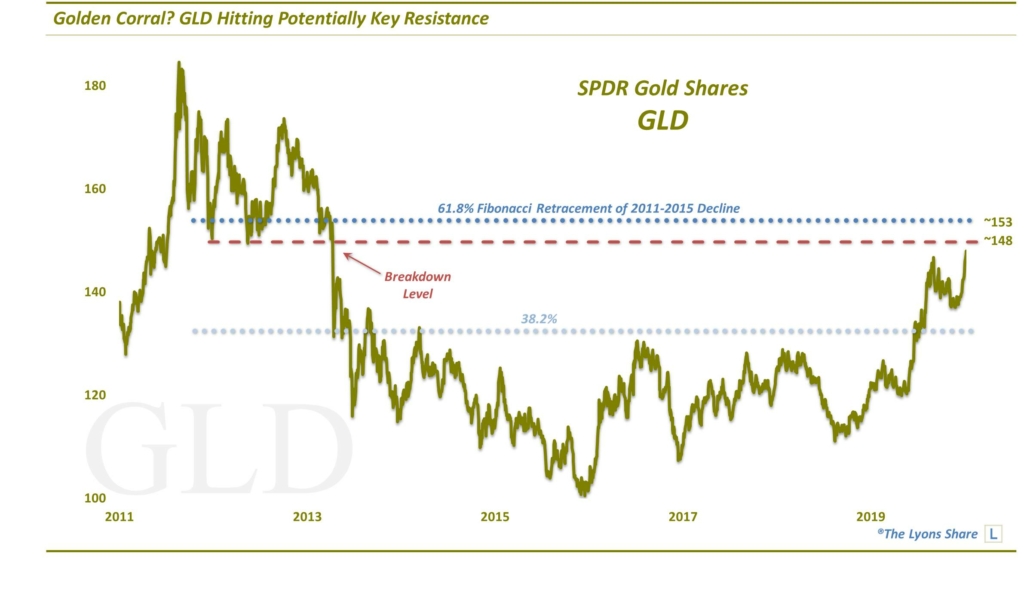
As it happens, GLD closed at 147.97 yesterday and as members know (if you listened to today’s Daily Strategy Session), we did take considerable profits just north of 148 yesterday. For the latest updates, please listen to the DSS posts.
Now, while prices are the final factor in investment/trade decisions, there are other factors that we do consult when considering our investment posture. First and foremost are our quantitative investment models. However, besides those, there are other tools that can be helpful. Included among them is the study of sentiment.
Sentiment is the level of bullishness/bearishness among investors. When sentiment reaches an extreme, one way or another, it can be a sign that most of the participants are already aboard the prevailing trend and that prices are vulnerable to reverting in the other direction. Gold sentiment is currently at historic levels of bullishness — at least according to one source.
The CFTC’s Commitment Of Traders (COT) Report tracks the net positioning of various groups of traders in the futures market in the COT report. One such group is called Commercial Hedgers. As their name implies, their main function in the futures market is to hedge. On the other side of the ledger – and normally with a mirror image position – is the Non-Commercial Speculator group. These Speculators are typically funds engaged in, you guessed it, speculating. Speculators’ positions tend to follow prices while Hedgers’ positions generally move in the opposite direction. During an extended price trend, Speculators may fare well as they will likely be positioned consistent with the trend. On the other hand, it is almost always the case that Speculators will be incorrectly positioned – and to an extreme – at major turning points in a market. And while the moniker may not be fair, it is for this reason that the Speculator group is most often considered “dumb money”.
If that moniker is to hold weight, it may indeed be bad news for gold prices. That’s because Non-Commercial Speculators in gold futures are the most net long they have ever been (for contrast, check out our post from December 2015 — THE low month in gold prices — when we mentioned that Speculators were the most net short in 13 years!). This chart shows the Commercial Hedgers, aka, “the smart money”, who conversely are at the largest net short position on record.
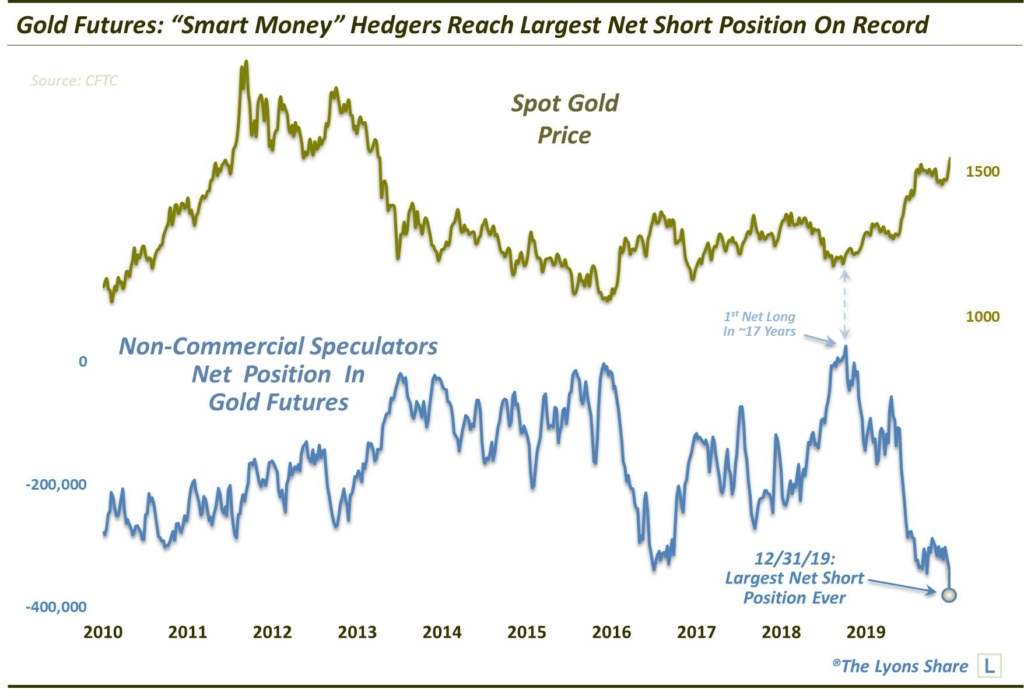
This not only suggests considerable risk in the gold market currently — it reinforces our notion of significant resistance nearby and the prudence of taking some profits here.
Again, stay tuned to the Daily Strategy Session videos for the latest updates on our investment positioning.
_____________
Disclaimer: JLFMI’s actual investment decisions are based on our proprietary models. The conclusions based on the study in this letter may or may not be consistent with JLFMI’s actual investment posture at any given time. Additionally, the commentary provided here is for informational purposes only and should not be taken as a recommendation to invest in any specific securities or according to any specific methodologies. Proper due diligence should be performed before investing in any investment vehicle. There is a risk of loss involved in all investments.