WASHOUT?
Considering the evidence of a potential washout low in the stock market.
“Catching falling knives” in the stock market is not our cup of tea. We have found the tactic to be just as hazardous to one’s portfolio health as it sounds. However, there does come a time in a steep market decline when things get so bad they can only get better (usually). We call these market “washouts” and they represent conditions where we will abandon our apprehension to knife-catching and take a chance on buying into extreme weakness.
We have found, however, that it is a dangerous task to attempt to identify washouts by targeting “price levels”. As traders have learned over the past week, during a panic selloff, falling knives can slice right through what normally may be reliable support, leaving one’s P&L a bloody mess. Instead, we prefer to focus on other market data pertaining to sentiment that historically move between reliable boundaries (usually) as opposed to prices, which can always go lower. When such metrics reach historically “washed-out” levels, we have found them to be more reliable signals.
In this post, we take a look at data from 3 areas: breadth, volatility and trader positioning in search of potential wash-out signals.
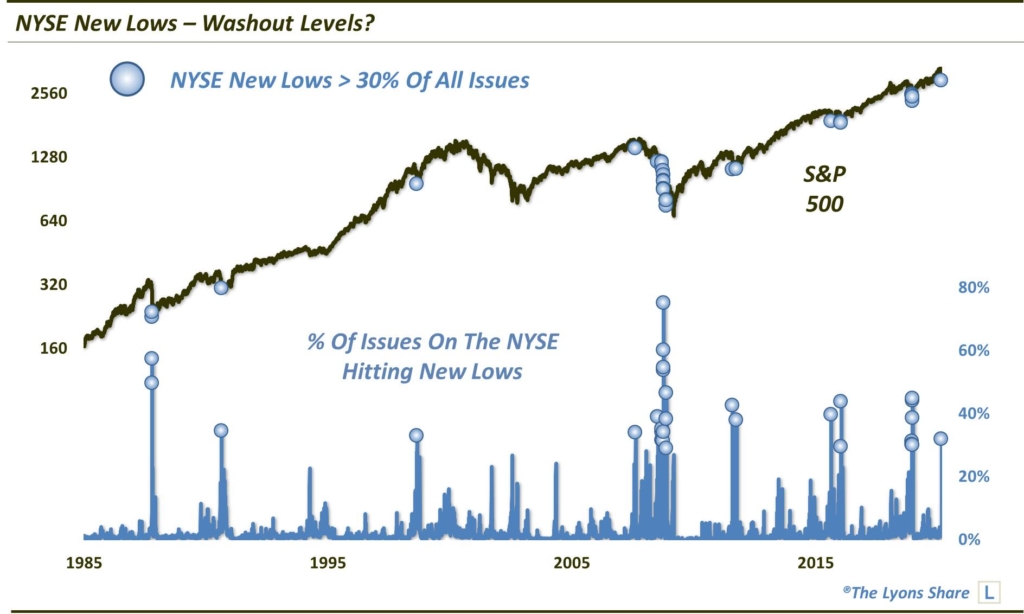
Breadth
On Friday (February 28), NYSE New Lows came in at over 20% 30% of all issues traded on the exchange. This is an extreme number, historically, and has often coincided with market lows of some magnitude. Although, this one certainly has gotten more extreme at times.
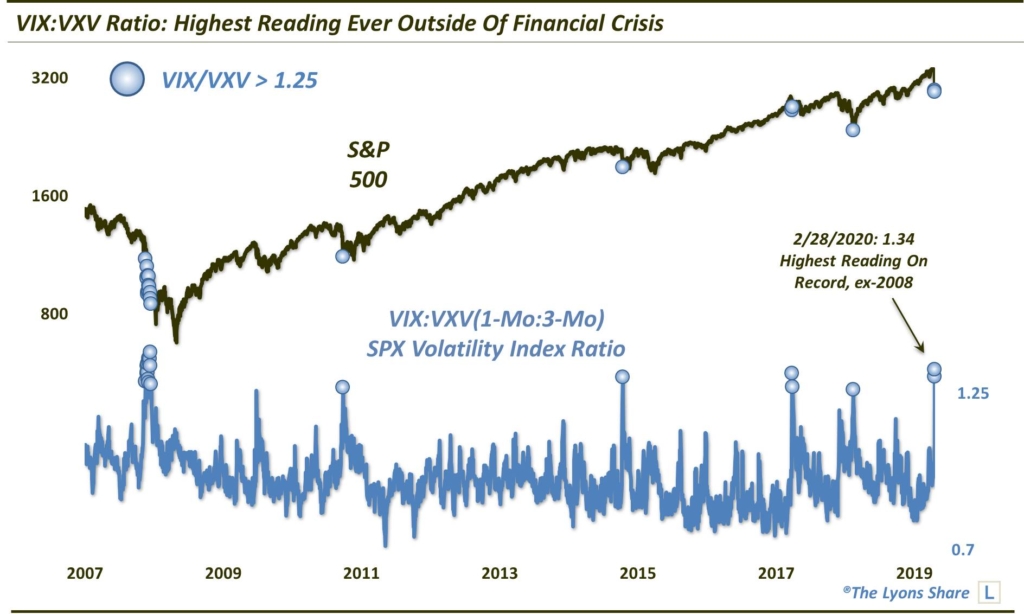
Volatility
On Friday, the 1-Month Volatility Index on the S&P 500 (VIX) moved to a level of 1.34 times that of the 3-Month Index (VXV). This relative bidding up of near-term volatility is an indication of trader fear. In this case, it is the highest, or most fearful, level in the history of the VXV, outside of the 2008 financial crisis.
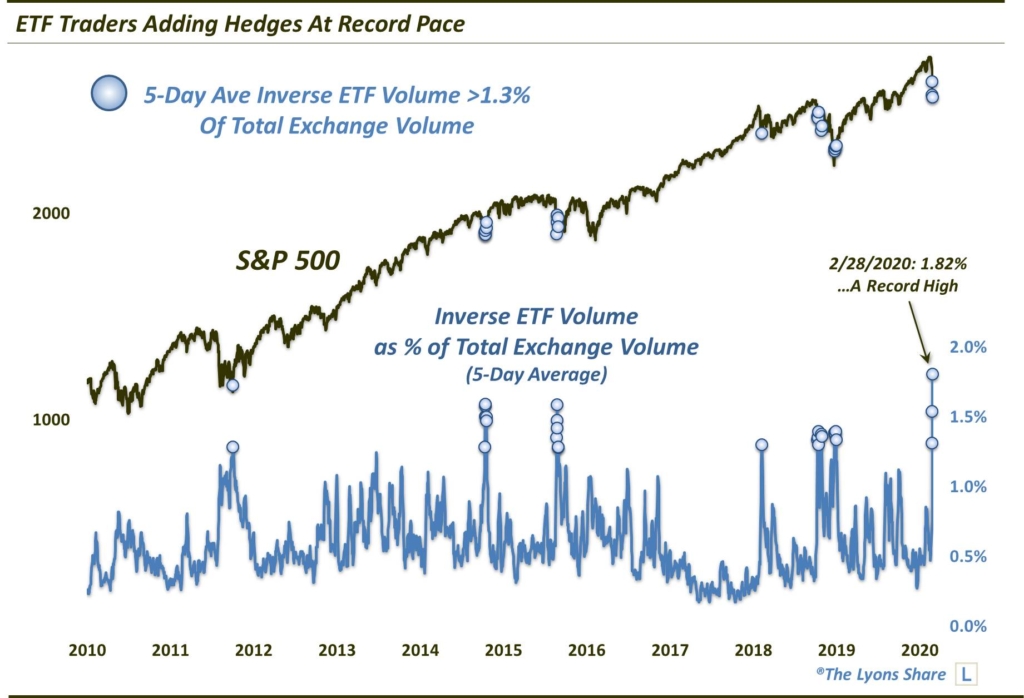
Trader Positioning
Traders came into this recent market rout with an extremely low level of hedges on. That lack of protection is, in fact, one factor that can exacerbate a selloff like we’ve seen these past few days. That condition has changed, however, as evidenced by the amount of trading going on in inverse ETF’s. Using a 5-day average, the amount of trading volume in ETF’s relative to overall exchange volume reached a record high on Friday (of course, inverse ETF’s were not yet widely used during the financial crisis).
So do these metrics represent a washout in the stock market — and a “nowhere-to-go-but-up” situation? That is debatable. However, in our view, this evidence, in conjunction with plenty of other risk-assessment tools that we use, was enough to add more exposure back into equities — and issue a short-term Bullish Outlook for members of our All-Access site, The Lyons Share. Things could always get worse — and they probably will. However, unless “it is different this time”, these types of signals are good clues that sentiment may have gotten washed out enough to turn the tide back in favor of the bulls, even if temporarily.
To see exactly what we are doing in the market based on this and other risk-managed criteria, please check out our All-Access site, The Lyons Share. You can follow our investment process and posture every day — including insights into what we’re looking to buy and sell and when. Thanks for reading!
_____________
Disclaimer: JLFMI’s actual investment decisions are based on our proprietary models. The conclusions based on the study in this letter may or may not be consistent with JLFMI’s actual investment posture at any given time. Additionally, the commentary provided here is for informational purposes only and should not be taken as a recommendation to invest in any specific securities or according to any specific methodologies. Proper due diligence should be performed before investing in any investment vehicle. There is a risk of loss involved in all investments.

1 Comment