Global Equities Encountering Resistance At Year-End

The Global Dow Index is running into its long-term Down trendline stemming from the 2007 all-time peak.
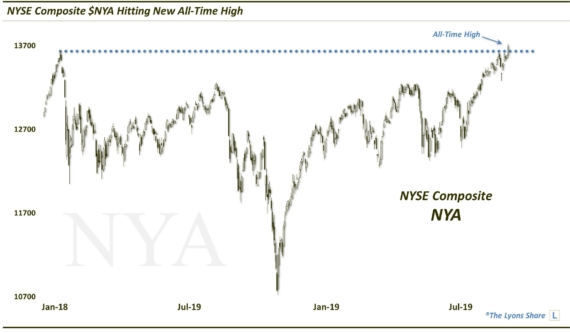
Here in the U.S., equity investors have been a bit spoiled as they’ve watched index after index break into all-time high ground this year. Around the globe, investors have not been so lucky. Yes, most international indices have rallied solidly this year. However, with few exceptions, the rallies have still left these international markets shy of their all-time highs. One illustration of this situation can be seen in a chart of the Global Dow Index (GDOW).
We’ve posted many times on the GDOW due to its reliable conformity to technical charting tools, despite the fact that very little money is traded off of it. Additionally, we have found it to be an accurate barometer of the state of the global equity market. Specifically, the GDOW is an equally-weighted index of 150 of the world’s largest stocks. While this includes U.S.-based companies, its heavy dose of international exposure has led to its aforementioned position below its all-time high.
Furthermore, it is currently running into potential resistance in the form of its post-2007 Down trendline connecting the 2007, 2014 and 2015 tops.
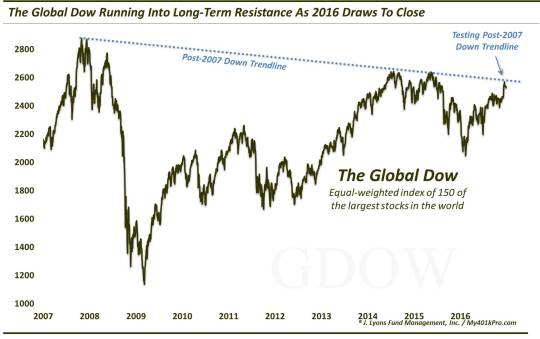
Will this hold? We don’t have a crystal ball, but it has briefly repelled the GDOW thus far. And while most U.S.-based indices have succeeded in reaching all-time high ground, it is important to note that such circumstances are not unanimous. Along with the Value Line Geometric Composite, there are still some key hurdles facing global stocks as we head into 2017.
________
More from Dana Lyons, JLFMI and My401kPro.
The commentary included in this blog is provided for informational purposes only. It does not constitute a recommendation to invest in any specific investment product or service. Proper due diligence should be performed before investing in any investment vehicle. There is a risk of loss involved in all investments.