Something’s Askew In This Market

CBOE’s Skew Index, a measure of “tail risk” is at an extreme – unusual given current circumstances.
One definition of skew is distortion. In a way, the CBOE SKEW is a measure of the distortion of options pricing. Specifically, the SKEW is an Index calculated from S&P 500 out-of-the-money options that measures perceived tail risk, i.e., an outlier event two or more standard deviations below the mean. Essentially, it measures options traders’ perceived risk of a major decline (more at CBOE.com). Typically, the SKEW ranges from 100 to 150. Readings close to 100 indicate that the perceived probability of an outlier return is negligible whereas readings approaching 150 suggest the probability is significant.
Recent days have seen several readings in the 140′s, an extremely elevated level from a historical basis. The thing is, these readings are occurring amid circumstances unlike those during any other historical extreme reading – except for one. You might say that these recent signs of extreme options distortion are themselves distorted.
Here’s a look at all 13 SKEW readings above 140 since its inception in 1990.
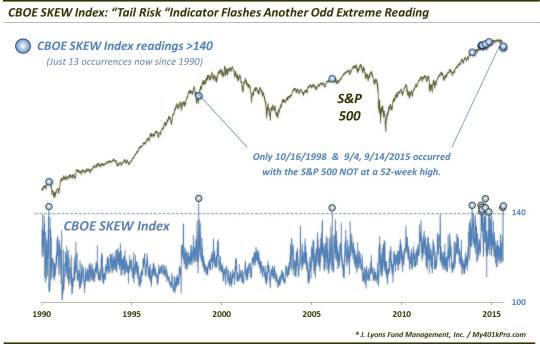
As the chart suggests, one of the odd things about the recent Skew extremes is that the market, as represented by the S&P 500, has already experienced a sharp decline from its recent highs. Typical high readings have historically come with the index at or near its highs. It is because of that, somewhat, that the fat tail exists. Most market observers are oblivious to a “black swan” type event when the market is trading at a 52-week high.
For example, the Skew indicator gained its notoriety largely on the back of the first ever warning reading above 140 in June of 1990. At the time, the S&P 500 was on a multi-year rally and just off of its 52-week high. 6 weeks later, Saddam Hussein invaded Kuwait and the S&P 500 would proceed to drop 20% over the next 3 months.
Although the 1990 occurrence was the only extreme reading that led to any facsimile of a black swan event, it was not the only one that proved useful. In fact, 10 of the 11 occurrences prior to 2015 could reasonably be considered non-contrarian warnings of at least sub-par returns to follow.
The maximum gain over the 3 months following ANY of those 10 events was just +2.6%. Conversely, the maximum 3-month drawdown was greater than that following EACH of the occurrences. So the risk/reward has been negatively “skewed” over the intermediate-term follwing these readings over 140. And keep in mind, many of these occurrences took place during an overall favorable market in 2013-2014.
Back to the unusual nature of the current readings. As mentioned, the extreme readings have typically come with the market near its highs. Of the 13 readings ever over 140, 7 occurred with the S&P 500 at a 52-week high. 2 others saw the S&P 500 within 0.36% of a high and the 1990 occurrence took place with the index just 1.91% from its high. The other 3 readings have been atypical. These include the two readings in the past few weeks and one from October 1998. Each of those took place with the S&P 500 between 8% and 11% below its 52-week high.
This scatter plot illustrates the unusual nature of these 3 readings, in terms of the S&P 500′s position relative to its highs as well as the position of its Volatility Index (VIX). You can see why we say these unique examples of the distorted Skew are themselves distorted.
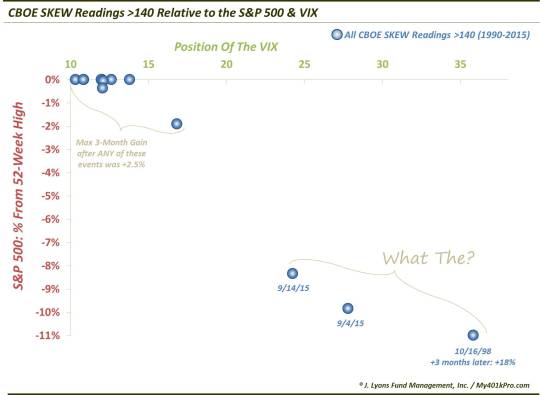
As with the distance from the S&P 500′s high, the VIX readings during the recent events jump out at us. 10 of the 13 extreme Skew readings occurred with the VIX trading between 10 and 17. The other 3 events (including 2 this month) saw the VIX between 24 and 36.
Now with the “normal” extreme readings shown in the upper left of the plot, we know what to reasonably expect out of the market. But what’s with these outliers in the bottom right? Should the options market really be pricing in extreme tail risk after a mini-crash has already occurred?
Well, unfortunately we have only one precedent to look to that resembles these recent readings at all. That took place on October 16, 1998, after the S&P 500 had begun to recover following a 20% drop. For what it’s worth, the aftermath of that reading was the complete opposite of each of the others. This instance experienced ZERO drawdown over any period. And 3 months following the reading, the S&P 500 was over 18% higher.
Now, we strongly caution folks against automatically extrapolating that experience to our present situation. We would probably say that under any circumstances containing just 1 precedent. However, despite some obvious similarities between the 1998 event and today, there are plenty of differences as well. For one, the 1998 occurrence was coming off a recent retest of a mini-crash of its own. Meanwhile, today’s market has yet to test the crash low of late August. We’re not saying it has to re-test – only that there are enough differences to take pause when comparing the two.
So what’s with these odd extreme Skew readings? I am not smart enough to say. Sometimes, I like to merely point out an oddball situation and let readers or followers instruct me as to its meaning. So bring it on.
(By the way, as I finish this post, I notice that today’s reading in the Skew was #14 ever above 140. Interesting stuff…but too late to update the charts.)
______
More from Dana Lyons, JLFMI and My401kPro.
The commentary included in this blog is provided for informational purposes only. It does not constitute a recommendation to invest in any specific investment product or service. Proper due diligence should be performed before investing in any investment vehicle. There is a risk of loss involved in all investments.

