Will Stock Troops Lead The Generals Higher? (PREMIUM-UNLOCKED)
This is a free look at the type of original research pieces we produce for our members at The Lyons Share.
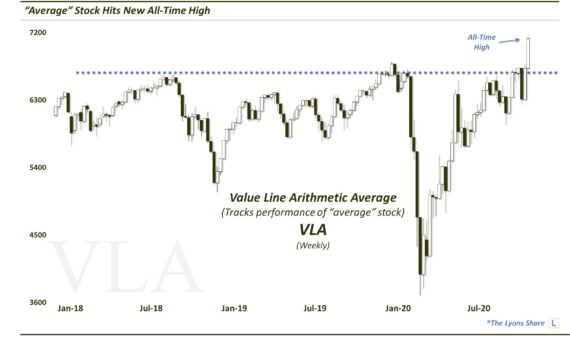
The NYSE Advance-Decline Line is back at all-time highs — does that mean the S&P 500 will follow suit?
We have talked about “divergences” plenty in the past. Typically, the topic revolves around either one sector hitting a milestone while another fails to do so (e.g., the Dow Theory involving the Dow Transports and Industrials), or a situation where an index is hitting a milestone while the broader market (e.g., breadth or internals) lags behind. Today, we take a look at current circumstances involving the latter type of divergence — but in the opposite direction. That is, the broader market of stocks is presently hitting new all-time highs, yet the large-cap, weighted S&P 500 is lagging well behind.
As mentioned, traditionally, we’ve focused on occasions when the major averages are hitting new highs, yet the broader market, e.g., the NYSE Advance-Decline Line is not. That can be a sign of waning participation in a rally among all stocks in the market. And as we are strong proponents of broad participation when considering our equity allocation, such “negative” divergences can be a warning sign that new highs in the averages are not sustainable.
Once again, though, we are seeing the opposite situation. That is, the NYSE A-D Line is at a new high while the S&P 500 is well below its own 52-week high. Does it follow then, as has been suggested by various financial outlets, that this “positive” divergence is an omen of good things to come for the SPX? As we always prefer an objective analysis, let’s take a peek at some historical evidence.
Specifically, let’s look back at all other times in the past 50 years when the SPX was at least 3% below its 52-week high while the A-D Line was sitting at a high.
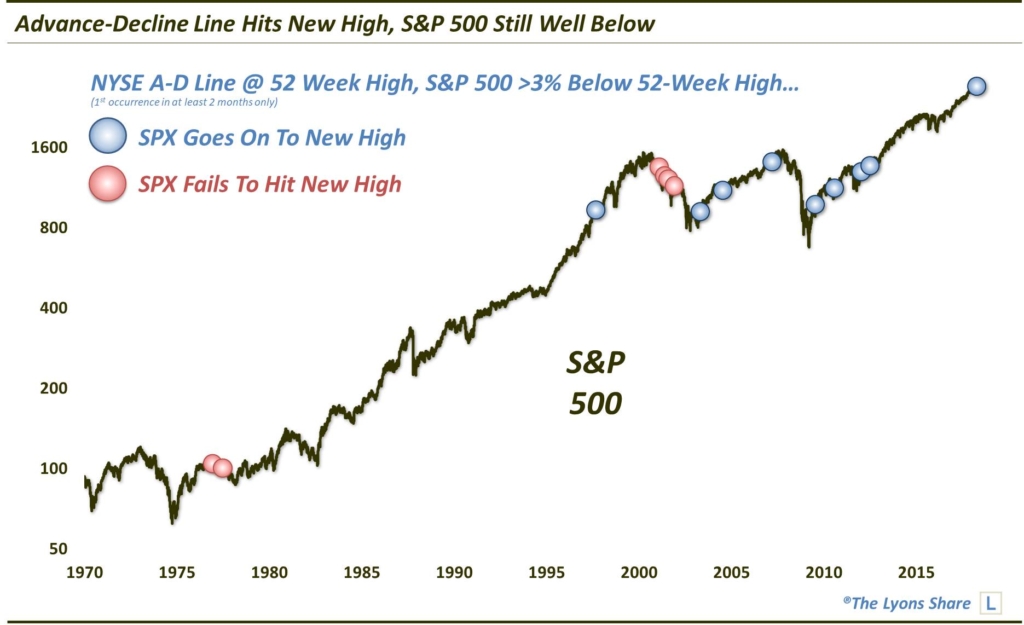
Not including clusters (i.e., occurrences within 2 months of each other), there have now been 15 unique occurrences going back to 1965. So did the prior 14 result in as favorable a market climate as the theory promises? Yes and no.
8 of the prior 14 events saw the S&P 500 go on to new highs prior to any serious weakness. And of the 6 events that did not, 4 occurred in 2001-2002, and the other 2 occurred in 1976 and 1977, respectively. So, not to dismiss the events that didn’t turn out so well, but they were concentrated around a few market junctures.
That said, returns in the S&P 500 were nothing to write home about, either from a median return — or a consistency of return — standpoint. Look at the numbers:

For a set of circumstances that are supposed to be very bullish, historical results just don’t live up to the hype. If anything, returns are closer to evenly distributed between positive and negative than they are overwhelmingly bullish.
If we look just at those occurrences when the SPX was more than 5% away from a new high, like it was in recent days, we find an even more striking lack of edge, up or down. Check out the symmetry following all such 128 days (not just unique occurrences) since 1965:
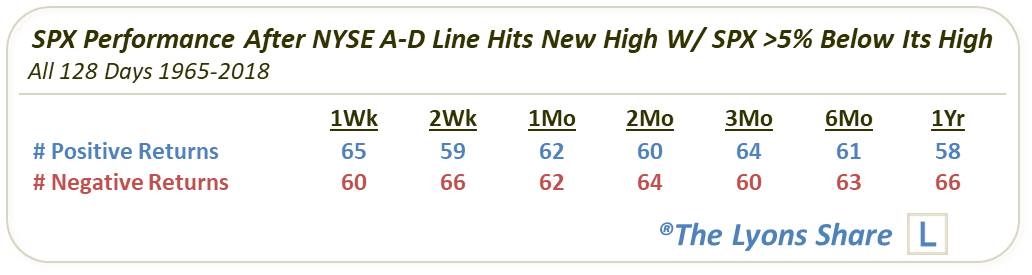
Now, we’re not going to go as far as to say this is a negative sign for the market. Indeed, we are big proponents of strong broad market participation, as we mentioned above. However, again, this is not the evidence of a supposedly overwhelmingly bullish “positive divergence” that stock bulls are pointing to. So while the S&P 500 may yet go on to a new high, it certainly is not a slam dunk, based on history.
If you’re interested in the “all-access” version of our charts and research, please check out our new site, The Lyons Share. You can follow our investment process and posture every day — including insights into what we’re looking to buy and sell and when. Plus, our SPRING SALE (25% OFF!!) is going on now so it’s a great time to sign up! Thanks for reading!
_____________
Disclaimer: JLFMI’s actual investment decisions are based on our proprietary models. The conclusions based on the study in this letter may or may not be consistent with JLFMI’s actual investment posture at any given time. Additionally, the commentary provided here is for informational purposes only and should not be taken as a recommendation to invest in any specific securities or according to any specific methodologies. Proper due diligence should be performed before investing in any investment vehicle. There is a risk of loss involved in all investments.