Oil Services Sector Reaches Resistance Magnet
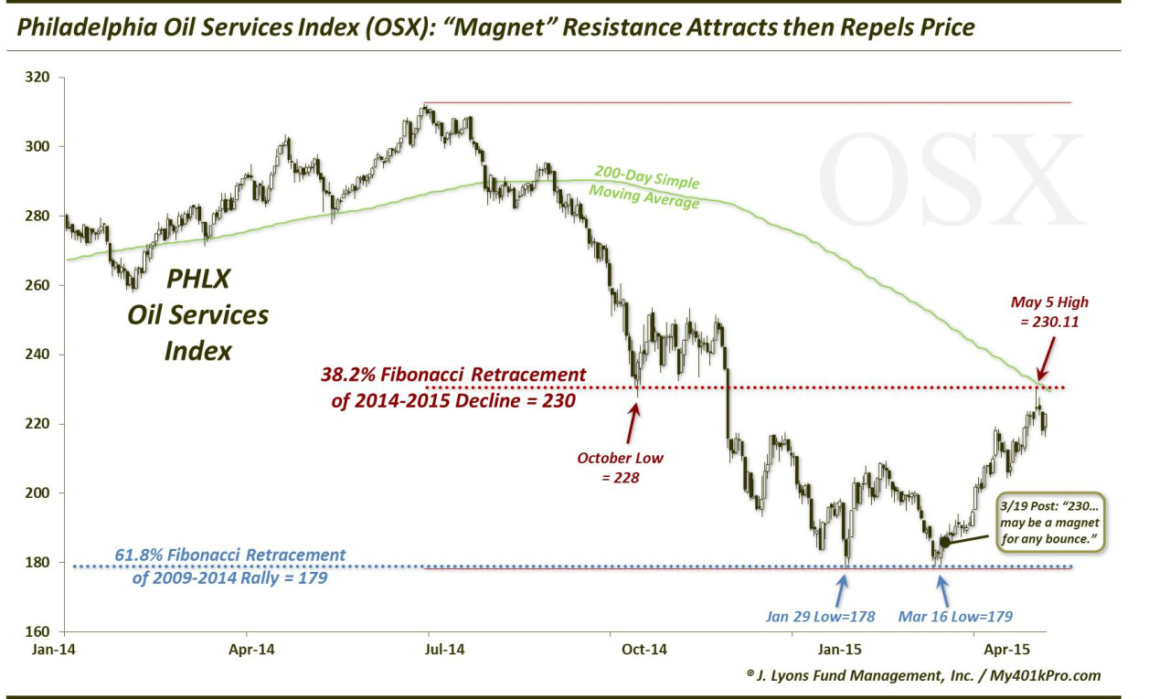
On March 19, as the oil complex was attempting to hammer out a low, we posted a chart on the Philadelphia Oil Services Index, or OSX (think Market Vectors Oil Services ETF, OIH). We used the post to demonstrate both the possibility that the OSX was attempting to bottom as well as the significance of Fibonacci levels in financial market movement. Specifically, we pointed out the proximity of the OSX to a major Fibonacci level, the 61.8% Retracement level.
After bottoming around 97 in 2009, the OSX peaked on July 1 of last year at 312 as the commodity was also topping out. Measuring the 61.8% (Golden) Fibonacci Retracement of that 2009-2014 rally yields a level of 179. In late January, the OSX hit a low of 178 before bouncing. And on March 16, it made a low of 179.05, precisely at the 61.8% level (I know…voodoo.) Of course, the level is only “respected” or significant if prices actually hold there and bounce. Well, bounce they did.
In our March 19 post, this is what we wrote about a possible bounce:
“…if the OSX either holds 179 or breaks it and immediately recover it, it has potential to launch a sizable rally. The previous breakdown area around 230, which also represents the 38.2% Fibonacci Retracement of the 2014-2015 decline (as well as the underside of the previously broken up trendline and potentially key moving averages), may be a magnet for any bounce. That would be a 25% move from these levels.”
6 weeks later prices have indeed been attracted to the magnet resistance, rallying 25% and hitting a high of 230.10 (they actually hit the level last week…we’re a few days late in issuing this update). And the level has indeed reacted as a repulsion magnet as well as OSX prices were summarily rejected at that price.
So what now? Well, the “easy” money has been made. We say that but buying these stocks in mid-March was anything but easy, in fact, the opposite. That is what makes investing so difficult. The right moves don’t typically “feel” right at the time. However, when the OSX was hitting the 61.8% Fibonacci Retracement level, that was the optimal time to buy.
We can understand if you prefer not to buy “falling knives”. We don’t like to either, and there are unlimited methods of potentially profitable trading that don’t require one to attempt that. However, if you do attempt it, prices should be in the vicinity of a major support area on the chart. Such major support levels would include the 61.8% Fibonacci Retracement of a 5-year long rally.
We understand that folks are hesitant to believe in such “voodoo” numbers. However,they would probably be surprised to learn how often they work. They would probably also be surprised to learn how many of the biggest investment firms in the world employ the strategy.
As far as the chart now is concerned, the easy money truly has been made, even if it wasn’t easy. The 230 level should be formidible as the immediate rejection would attest to. If the oil complex is to form a more durable low rather than merely producing a dead-cat bounce, it will need to overcome that level. If it does, the 61.8% Fibonacci Retacement of the July-March decline around 260 may be an eventual destination. In the meantime, the OSX would do well to hold the 200-210 level if it wishes to avoid another down-leg to new lows.
_____________
More from Dana Lyons, JLFMI and My401kPro.
The commentary included in this blog is provided for informational purposes only. It does not constitute a recommendation to invest in any specific investment product or service. Proper due diligence should be performed before investing in any investment vehicle. There is a risk of loss involved in all investments.