Are Investors Facing The Perfect Volatility Storm? (PREMIUM-UNLOCKED)
This post was originally issued to TLS members on May 9, 2019.
Despite the relatively close proximity of the major averages to their 52-week highs, there has been a significant spike in the volatility term structure; historically, such conditions have represented near-flawless buying opportunities.
Given the combination of the contentious U.S.-China trade talks, elevated sentiment conditions, assorted broad market divergences and a backdrop of long-term excessive conditions, some investors may be wondering if the market is up against a perfect bearish storm. However, while we would not dispute the legitimacy of most of those concerns, investors may be getting ahead of themselves when it comes to acting on their fears. That’s because, when looking historically at similar setups in the term structure of the stock volatility market, the only thing perfect has been the success rate of buying into such fear.
Once again, the term structure refers to the various durations of, in this case, the S&P 500 Volatility Indices vs each other. When the near-term indices rise substantially relative to those further out, it can be a sign of trader fear. And when the levels hit extremes, it can be one indication that fear is rampant enough to allow for a stock market bottom, of some magnitude. This is arguably the case right now, at least relative to the mild selloff seen in the stock market thus far.
Specifically, over the past few days, the VIX:VXV (1-month:3-month) ratio has jumped to over 1.00, a level often considered a “fearful” extreme. However, most of the historical readings over 1 have occurred following substantial declines in stocks. This one is taking place with the S&P 500 just 2.1% away from its 52-week high (as of 5/7). That is the 3rd closest proximity to a 52-week high of all the VIX:VXV readings over 1 since the inception of the VXV in 2007.
It is also just the 16th reading over 1 occurring with the SPX within 3.25% of its 52-week high. Here are all such historical occurrences.

It may not be extremely evident from the chart, but following some very brief turbulence at times, these events represented nearly unanimously favorable buying opportunities in the short to intermediate-term. Here are the dates and subsequent returns.
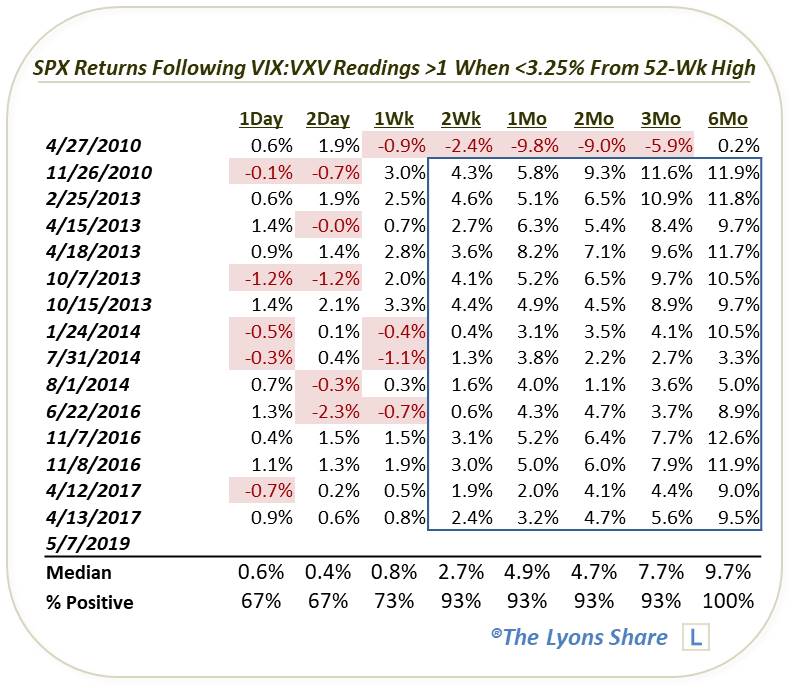
As the table indicates, except for the first ever occurrence which preceded the Flash Crash, each event led to positive performance from 2 weeks to 6 months out. The majority of the occurrences were unique events as well, not a clustered group of dates.
Is this another profitable buying opportunity in stocks? Time will tell. But while it does not feed into any of our objective models, it does mesh with our current thinking that the benefit of the doubt still remains with the bulls. Furthermore, the volatility spike appears to be related to a news item (U.S.-China trade talks), rather than organic market-inspired action. Historically, similar events (e.g., Brexit, the 2016 U.S. election, etc.) have seen such volatility hedges eventually proven to be unfounded.
Therefore, while volatility traders may be freaking out about the trade talks, the better response by market participants may be to take advantage of their, perhaps, unfounded fears and buy the dip.
If you are interested in an “all-access” pass to our research and investment moves, we invite you to further check out The Lyons Share. Given an treacherous emerging market climate, there has never been a better time to reap the benefits of our risk-managed approach. Thanks for reading!
_____________
Disclaimer: JLFMI’s actual investment decisions are based on our proprietary models. The conclusions based on the study in this letter may or may not be consistent with JLFMI’s actual investment posture at any given time. Additionally, the commentary provided here is for informational purposes only and should not be taken as a recommendation to invest in any specific securities or according to any specific methodologies. Proper due diligence should be performed before investing in any investment vehicle. There is a risk of loss involved in all investments.