Volatility Futures Signaling Rare Levels Of Fear

The “term structure” of a futures market refers to the pricing of the various months in relation to each other. For example, in the VIX futures (S&P 500 Volatility Index), it is typical for the front month contract to be lower than prices of contracts that expire further out. This makes sense as the longer horizon one deals with, the greater the odds of a risk-causing event occurring. Therefore, VIX futures prices, say 3 months away, should be higher than those of the current month.
Every once in awhile, however, the term structure becomes inverted. That is, the 1-month VIX contract is priced higher than that of the 3-month contract. This is called backwardation. Regardless of the fancy term, it is an indication that traders are especially nervous about volatility or risk in the near-term. Historically, when the backwardation hits an extreme, the market has put in at least a short-term low in very short order (although it is not all good news). By most historical standards, it hit an extreme yesterday.
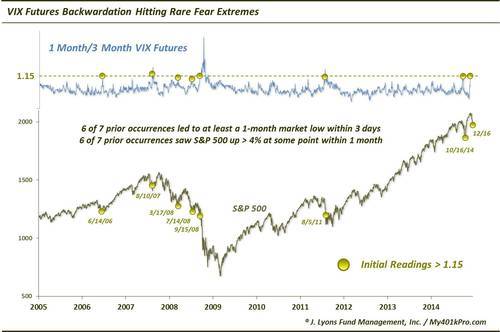
There have been 7 (now 8) distinct instances where the 1-Month/3-Month VIX futures ratio reached as high as 1.15. 5 of those 7 saw the S&P 500 form at least a short-term low by the very next day. In August 2007, the S&P 500 bottomed 3 days later and in September 2008, the signal failed to generate any sustainable rally.
Within 1 month, 6 of the 7 had seen the S&P 500 rally at least 4% at one point. Only the August 2011 event failed to do so, but only because it was down 7% the following day. From that next day, it would rally as much as 9% over the following few weeks. Even the September 2008 occurrence led to a 4-day pop in the S&P 500 of over 4%.
That is the good news.
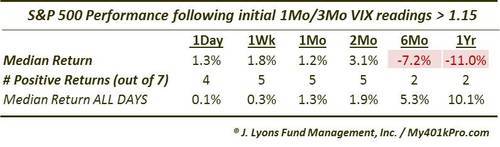
The bad news is that the longer-term returns following these events have not been too attractive. The median 1-year return is -11% for the S&P 500. Of course, this is a direct result of the dates of the occurrences (shown on the chart). Specifically, 4 of them were in 2007-2008. Therefore, their proximity to either the cyclical top or within the throes of the bear market result in the poor longer-term returns. Here is the performance of the S&P 500 following the previous events.
As the components in question – 1-month and 3-month futures – are geared toward the short to intermediate-term, we would tend to consider most of the signal’s utility to be within that time frame. That is, the signal is likely only relevant out to a few months.
One exception to that view perhaps, is in the possibility that the market environment is changing to one more akin to that of 2007-2008. While there are obvious similarities now to 2007, we have no way of knowing for sure. One potential clue that this environment change is indeed occurring, however, may be contained within this indicator. We have now seen 2 separate incidents of extreme VIX backwardation within the past 2 months. The only other time this has happened was in 2008. One precedent is obviously very little evidence to rely on; however, it is a possibility that we are transitioning to a higher volatility environment.
Whether or not there are long-term consequences, or at least coincidences, subsequent to this signal, we don’t know. For now, the extreme backwardation between the 1-month and 3-month VIX futures is one piece of hopeful evidence in the short-term for the bulls. At least if history is any indication.
________
“The Mind Eraser” photo by Scott Ableman.
More from Dana Lyons, JLFMI and My401kPro.