Stick a fork in the Nikkei’s 20-year downtrend

One of the two most notorious trendlines in the macro financial landscape over the past few decades has been the downtrend in Japan’s Nikkei 225 (the U.S. 30-year bond yield is the other). After the Nikkei bubble burst in 1990 and sent the index crashing more than 60% over the next 2 years, it settled into a remarkably defined downtrend. Four times since then, the Nikkei has bounced off of the down trendline. On a monthly basis, the index closed above the trendline Friday for the first time in more than 20 years (plotted on a log scale).
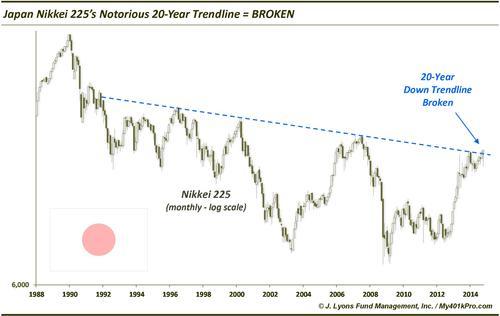
Considering the duration of the trendline, this is a monumental development. The fact that this trend break occurred due to Friday’s BOJ stimulus-inspired monster 5% rally in the Nikkei may give some pause regarding its validity and sustainability. However, an epic trendline deserves an epic trend break. Plus, 6 years (or 6 months) from now, there will be no thought paid to the cause ascribed to the price chart action on Friday.
That said, a break of the downtrend does not guarantee the initiation of a new long-term uptrend. It simply means the downtrend, or at least the trajectory of it, has been broken. It is possible that the index enters an extended sideways pattern before the start of an uptrend (or a new downtrend). There is some evidence to suggest that further near-term strength is in the cards for the Nikkei, however.
Following the near 100% jump in the Nikkei in the first half of 2013, the index has rather tightly consolidated the gain. Some may consider it an ascending triangle, others a bull flag. Either way, it is suggesstive of a continuation pattern. That is, it should continue the trend that was in place prior to its consolidation, i.e., up. This is perhaps best seen in a quarterly chart, shown here.
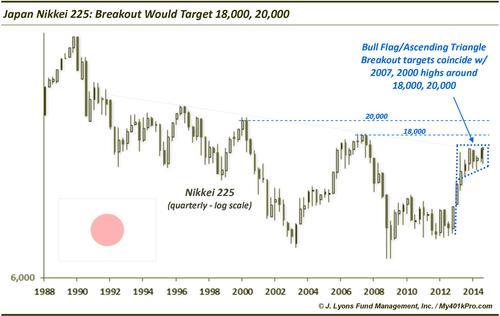
As seen in the chart, the Nikkei has generally moved sideways after the early 2013 rally, setting up the continuation pattern. And while the October action was enough to break the 20-year down trendline, it has not yet broken above the near-term horizontal resistance established by the pattern. These patterns typically resolve themselves higher, however.
Assuming it does break higher, initial projected targets from such a breakout would come around 18,000 and 20,000. These points would represent almost 10% and over 20% rallies, respectively, from current prices. Interestingly, these levels closely line up with the highs made in 2007 and 2000. Therefore, while not a guarantee to break out, those levels bear watching should it occur.
At a minimum, the down trendline that has been in place for over 20 years in the Nikkei 225 has now been broken. Again, while this doesn’t guarantee a new uptrend, other evidence does suggest higher prices in the near-term. And while folks may take exception with the manner in which the trendline was broken, i.e., stimulus-induced, currency devaluation, etc., the fact is it has been broken. And that is some measure of good news for a nation’s stock market that has been sorely in need of it for several decades.
________
“Fork macro” photo by Holley And Chris Melton.
More from Dana Lyons, JLFMI and My401kPro.