ChOTD-4/30/14 “Sell In May & Go Away” With A Few Twists, 1 Good, 1 Bad
The “sell in May and go away” phenomenon refers to the market’s tendency to underperform from May through October. It is well known on Wall Street primarily because it is one of the few market adages that actually has the historical data to back it up. Today’s charts look at the phenomenon from a couple new perspectives, one offering a positive spin on this year’s May-October prospects and one a negative.
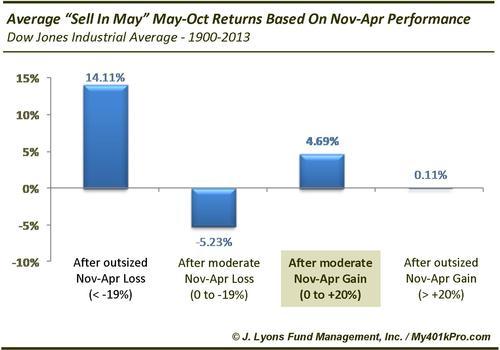
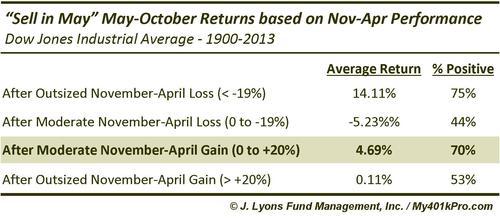
First, the good: following a November-April period that saw moderate market gains, May-October has averaged 4.69% since 1900. While not gangbusters, it is much better than the 1.5% averaged over all the May-October periods.
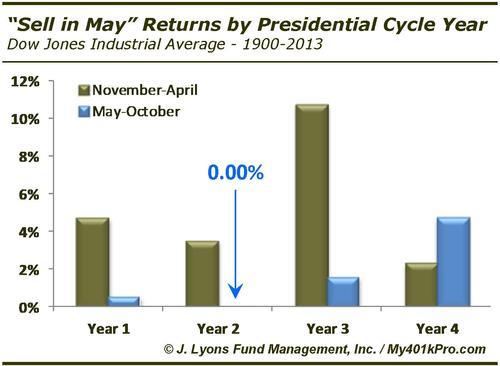
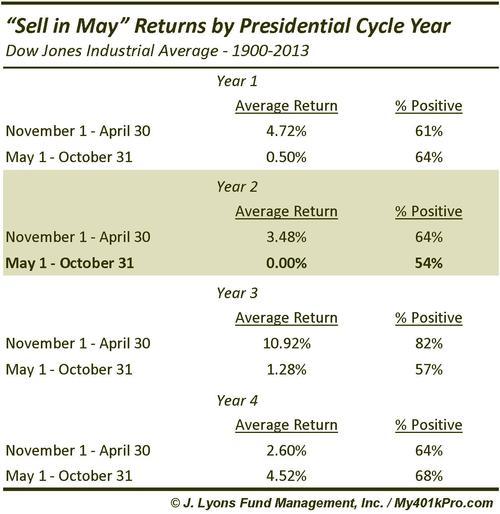
Now the bad: year 2 of the Presidential Cycle has historically produced the worst returns from May to October, averaging exactly 0.00%.
The force that exerts itself most strongly on the May-October period remains to be seen. Combined with other studies we’ve reviewed however, our best guess would be that the historical weakness that has accompanied this period will quite likely manifest itself.