ChOTD-5/27/14 S&P 500 @ 52-Wk High, NYSE 5-Day Volume @ 52-Wk Low
Today’s ChOTD points out a remarkable development (a recurring theme recently) from Friday. The S&P 500 closed at a 52-week high while NYSE volume, on a 5-day average basis, closed at a 52-week low. (Note: we excluded 5-day volume readings occurring in late Decembers during holiday trading. These days produce the lowest figures each year and since the low levels during this period are a result of seasonality rather than market factors, the readings are not valid for comparison.)
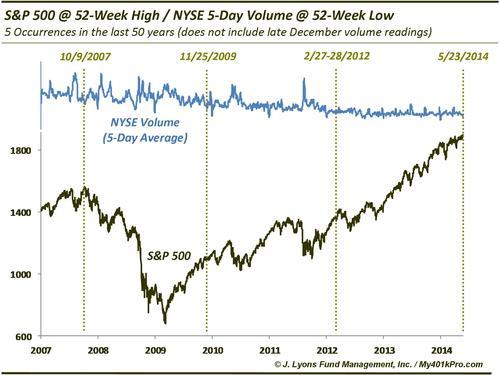
As it turns out, this combination has only occurred 4 other times in the past 50 years, all since 2007. Interestingly, one of the days was October 9, 2007, the very day of the S&P 500’s high close during the last market cycle. We typically pay little attention to volume as we haven’t found it to be very useful in analyzing price action. However, when volume readings are this extreme, it begs attention. This study is particularly noteworthy given the 10/9/07 occurrence. Even after the 2009 and 2012 occurrences, the market struggled for about 3 months. Therefore, we’d consider this a minor negative for the market.


