ChOTD-6/10/14 Median Distance From 52-Week Highs: S&P 100 Vs. Russell 2000
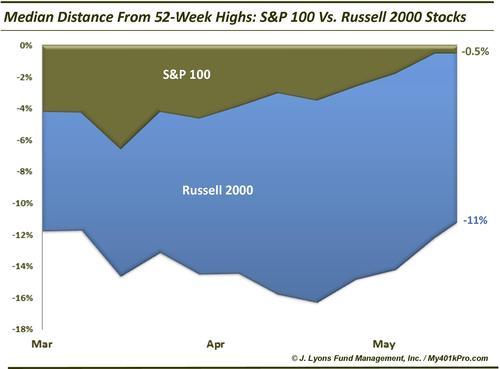
To be honest, when we first considered posting this chart a few days ago, we thought it mainly another piece of divergent evidence pointing to the weakness in the small cap space (we were initially going to post the chart on average rather than median distance since, at the time, the average Russell 2000 stock was right at the -20% “bear market” distance from its 52-week high.) However, just as telling is the continued strength in mega-cap stocks – as the chart indicates, the median S&P 100 stock is a mere half a percent from its 52-week closing high.
As with yesterday’s chart, our main takeaway isn’t necessarily a commentary on the broad market but on the importance of maintaining focus on relative strength. Despite a few strong days in the Russell 2000, on a relative basis, the large cap space is still the desired territory for those looking to mine for long positions. Stick with the winners.


