ChOTD-6/3/14 Why The Recent Highs *LOOK* Like A Fitting Top: Dow Edition
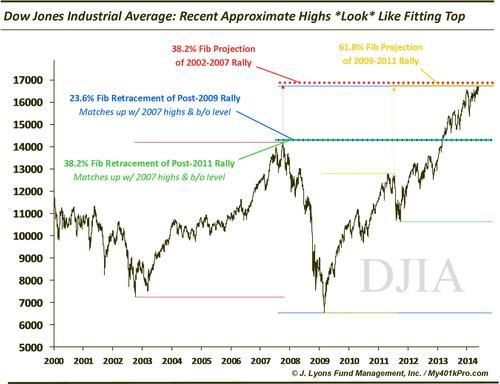
As one can see on the chart, the recent Dow high occurred at an area in close proximity to key levels according to two Fibonacci analyses. First, these projection levels:
-
38.2% Fibonacci Projection of the 2002-2007 rally
-
61.8% Fibonacci Projection of the 2009-2011 rally
Additionally, as we did with the Russell 2000 yesterday, by projecting where key future Fibonacci support levels would be based on recent highs, we can sort of reverse-engineer a top. For example, given the level of the recent high in the Dow, future key retracement support sits at an important area:
-
23.6% Fibonacci Retracement of the post-2009 rally roughly lines up with the 2007 high
-
38.2% Fibonacci Retracement of the post-2011 rally also roughly lines up with the 2007 high
Again, we will reiterate that we are not calling a top. We are merely pointing out the convergence of very key levels near or based off of recent highs in the Dow. Although, given the multitude of red flags that keep popping up in the market, we would certainly not be surprised if a top does develop in this approximate area.