ChOTD-6/5/14 Why The Recent Highs *LOOK* Like A Fitting Top: S&P 500 Edition
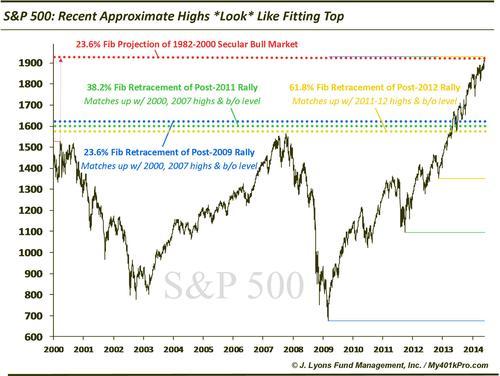
The S&P 500 may be the least convincing of the four indices we’ve looked at in terms of “toppiness”. However, there are intriguing levels that beg attention. Of particular note is the placement of key Fibonacci support levels based off of recent highs. Looking at markets in this fashion is a way to sort of reverse-engineer where an approximate top may form. For example, given the level of the recent high in the S&P 500, future key retracement support sits at an important level:
-
23.6% Fibonacci Retracement of the post-2009 rally roughly lines up with the 2000 and 2007 highs/2013 breakout level
-
38.2% Fibonacci Retracement of the post-2011 rally roughly lines up with the 2000 and 2007 highs/2013 breakout level
-
61.8% Fibonacci Retracement of the post-2012 rally roughly lines up with the 2000 and 2007 highs/2013 breakout level
In addition, the recent high is in the vicinity of a key Fibonacci projection level:
-
23.6% Fibonacci Projection of the 1982-2000 secular bull market
With the S&P 500 still motoring to new highs, time will tell if these analyses mean anything to the index (or the other indices). As we have posted recently, however, there are plenty of other concerns now that make these levels interesting.


