Chart Of The Day: CBOE SKEW Index >130 Every Day This Month
OK, we promised not to post any more charts on the CBOE SKEW Index considering its persistent streak of extreme readings (it’s like trumpeting a new high in the S&P 500 every day); however, this is getting ridiculous. As a refresher, the SKEW Index is a measure of perceived tail risk in the market based on the demand for left tail, out-of-the-money S&P 500 puts (more info at the CBOE ). The indicator drew attention in 1990 for correctly issuing warning signs of ahead of Iraq’s invasion of Kuwait and subsequent market decline.
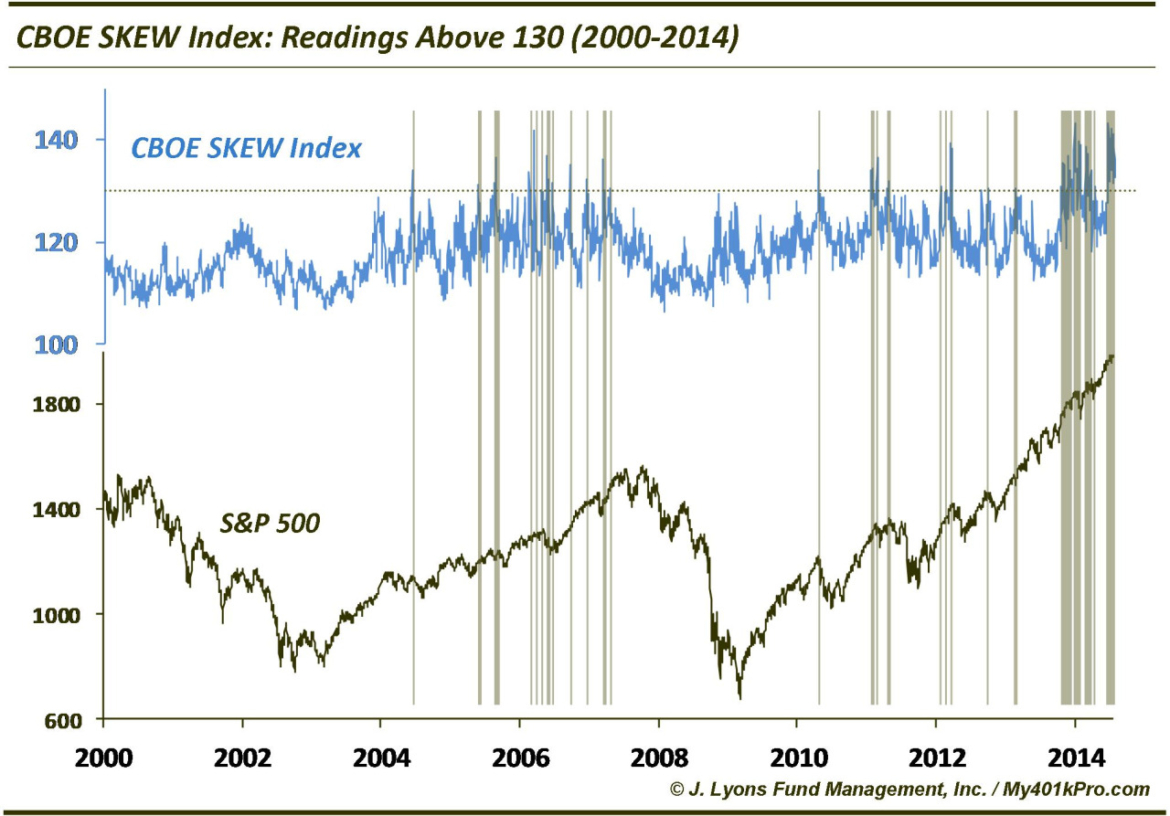
Readings above 130 are generally considered to be extreme, i.e., perceived market tail risk is elevated. Incredibly, every day this month has seen the SKEW above 130. To get an idea of how amazing this streak is, consider that from 1991 to 2012, the SKEW reached the 130 level on 64 occasions or, on average, less than once every 4 months. It has been above 130 for 24 days in a row and 89 times in the last 9 months. While the current low volatility makes it very cheap to purchase these left tail puts, traders obviously are concerned about an outlier type of market event considering the level of buying.
Will this warning prove prescient? Or does the increase in SKEW diminish the likelihood of major damage since traders are somewhat hedged against it? Historically, since the accurate 1990 warning, the SKEW Index has a spotty record. It has been very early on occasion and just plain wrong on other occasions. In recent years, it has been fairly accurate in warning of intermediate-term risk, with signals in April 2010, April 2011, March 2012 and September 2012. However, like all risk indicators, the plethora of signals since the start of the post-November 2012 rally have been utterly worthless. Eventually this streak of unprecedented readings will be right but there’s no telling when that will be.
We promise this will be the VERY last SKEW post for awhile…unless it hits 150 for the first time ever.