ChOTD-7/11/14 High ISE Equity Call/Put Readings On Down Market Days Have Preceded Drawdowns
Today’s ChOTD looks at the International Securities Exchange (ISE) Equity Call/Put Ratio. For those unfamiliar, ISE presents options ratios a bit differently than most exchanges. For one, they express it with “call” volume as the numerator rather than denominator. Secondly, they only use “opening” long transactions in their calculations. Thirdly, they exclude market maker and firm trades. Because of the last two points, ISE believes their call/put ratios result in better pure readings on investor sentiment (more info at the ISE website). The ISE Equity Call/Put Ratio yesterday was interesting:
Typically, as with most options ratios, call buying is relatively lower than put buying on down days and vice-versa on up days. Yesterday, however, the ISE Equity Call/Put ratio was 224. Readings above 200 are perceived to represent relatively high call buying. That is unusual for a day in which the S&P 500 was down.
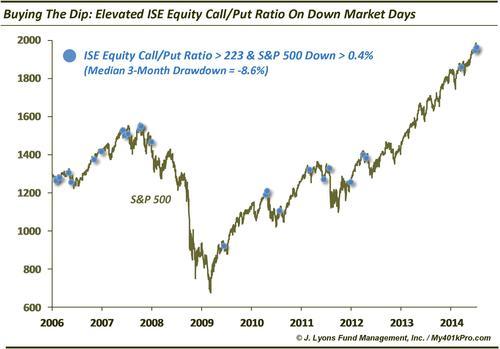
Looking at all days since ISE began publishing their data in 2006, we find 26 other days when the ISE Equity Call/Put ratio was higher than 223 and the S&P 500 was down at least 0.4%. As it turns out, many of them were clustered near intermediate-term tops, including 2007, 2010, 2011 and 2012. Thus, following these readings, the market typically struggled over the next few months. Specifically, the S&P 500’s average 2-month return was just -2.3%. More concerning, the median drawdown at some point over the next 3 months was -8.6%.
While not a guarantee of intermediate-term weakness (readings in 2006 and March of this year saw limited downside), the majority of readings were a warning that perhaps “buying the dip” was not the best strategy in the intermediate-term.


