ChOTD-7/14/14 Stock Market Bucking Weakest Presidential Cycle Stretch (so far)
At the end of March, we noted that the market was entering its historically worst 2-quarter stretch of the Presidential Cycle (Yahoo Finance covered our charts here). Both the 2nd and 3rd quarters of Year 2 of a Presidential term have seen the Dow Jones Industrial Average sport negative average returns from 1900-2013. Needless to say, the pattern is not followed every year as the recently finished 2nd quarter demonstrates.
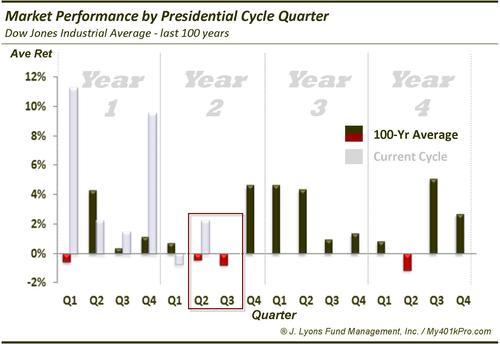
The Dow returned a modest +2.2% return in the 2nd quarter. Still that is better than the -0.4% average for the quarter. Not big news here, but we thought we’d update the chart.
If you’re wondering what has happened in the historically negative 3rd quarter of Year 2 following a positive 2nd quarter, here are the numbers:
- The average Dow return for all Year 2 3rd Quarters from 1900-2014 is -0.8%.
- The average Dow return for Year 2 3rd Quarters following a negative 2nd Quarter is -2.2%.
- The average Dow return for Year 2 3rd Quarters following a positive 2nd Quarter is +0.7%.
The market bucking its historical weakness in the 2nd quarter to finish with a positive return has boded better for the 3rd quarter, although the average return is a paltry 0.7%. Still, that’s better than a negative return.
We’ll revisit the topic again at the end of the 3rd quarter.