ChOTD-7/9/14 S&P 500 Days Above 200, 500-Day Moving Averages: Current Streak In Rarified Air
Plenty of folks in the financial blogosphere and media have discussed the S&P 500’s current streak above its 200-day moving average. We thought we’d add our name and unique charting touch to the discussion, including a historical look at the implication of such streaks on future performance. We have also included the S&P 500’s streaks above its 500-day moving average in the chart (MA’s are “Simple”).
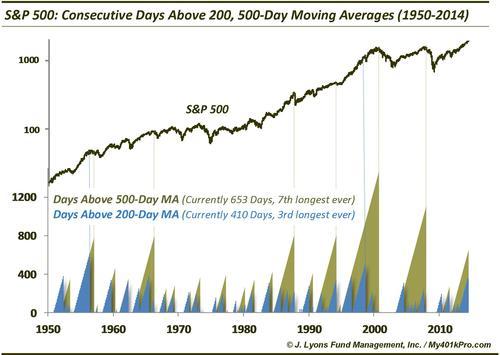
As noted on the chart, as of yesterday, the $SPX has been above its 500-day MA for 653 consecutive days, the 7th longest such streak since 1950. Meanwhile, it has been above its 200-day MA for 410 days, the 3rd longest in history. Only the mid-50’s and late-90’s saw longer streaks.
So what use is this to traders now? Probably not much, except as another confirmation of the market’s recent strength and notch in the belt of trend-following strategies. When these streaks end, however, is perhaps when the most value can be gleaned from them.
So what can one expect when these streaks end? If history can be a guide, let’s look at what the market did at the culmination of previous streaks. The 6 previous 500-day MA streaks were an interesting lot:
- 2 of them (ending in 1957 and 1994) occurred during the meat of secular bull markets. After the streaks ended, the market digested the gains (primarily sideways) for several months before continuing on to another monster up-leg.
- 1 ended just prior to the 1987 crash, leading to huge short-term losses but big gains in the longer-term.
- 1 ended in January of 2008, marking the end of the cyclical rally from 2002 and the onset of the financial crisis that brought huge losses.
- The last 2 (ending in 1966 and 2000) marked the end of secular bull markets and the top for the next decade-plus.
Numbers-wise, the market fared poorly following the end of these 500-day MA streaks, in addition to the fact that 2 of them marked the end of secular bulls. One year later, 4 of the 6 showed losses averaging -7%. Even 4 years after the end of the streaks, 3 of the 6 had negative returns.
As for the 200-day MA streaks, not many conclusions can be drawn from just 2 examples. However, like the first 2 examples in the 500-day MA streaks above, the 2 200-day MA streaks (ending in 1956 and 1998) that lasted as long as the current one came during secular bull markets and eventually led to further big gains. If we expand the sample to include streaks of up to 300 days, we get 8 more occurrences. 5 of them occurred in the 1950’s-60’s, 1 ended in 1983, 3 in the 1990’s and 1 ending in 2004.
Numbers-wise, stocks struggled some in the shorter-term. Half of the 10 saw losses 6 months out, with an overall average return of 2%. Even a year later, 4 of the 10 resulted in the market being down. However, by 2 years after the end of the streaks, 9 of the 10 saw positive returns, averaging +25%.
So what is the takeaway from these streaks? First, let the streak run its course, then reevaluate. After the 200-day moving average streak ends (which obviously will come first), several months of consolidation, at least, can be expected. However, judging by history, longer-term gains may well be in the cards. After the 500-day MA streak ends, however, things may be a little more serious. At the least, the 6-month to 1-year consolidation period may be more difficult than after the end of the 200-day MA streak. At the worst, it may mark the end of this cyclical bull market.
Perhaps the best thing to hope for once the 200-day MA breaks is for the S&P 500 to digest its gains in a sideways fashion such that it remains above the 500-day MA, giving it hope for a further major advance.


