Long-Term Sell Signal Triggered In Small Caps
Our investment process, for both managed assets and subscriber services, is entirely driven by market-derived data, as opposed to fundamental or economic input. In that sense, it could be argued that the basis underlying our whole process is rooted in technical analysis (TA). That said, we do not utilize many of the “traditional” TA tools as we’ve found they’ve lost some of their effectiveness throughout the years. We would guess that the proximate cause of their decline in effectiveness is likely an over-adoption by too many traders. This has led to widespread re-interpretation and increasing subjectivity of what used to be simple but effective tools. Of course, in our opinion, despite their increasingly subjective nature, traditional TA is certainly preferable as an investment foundation when compared to the malleability and just plain questionable worth of fundamental/economic data.
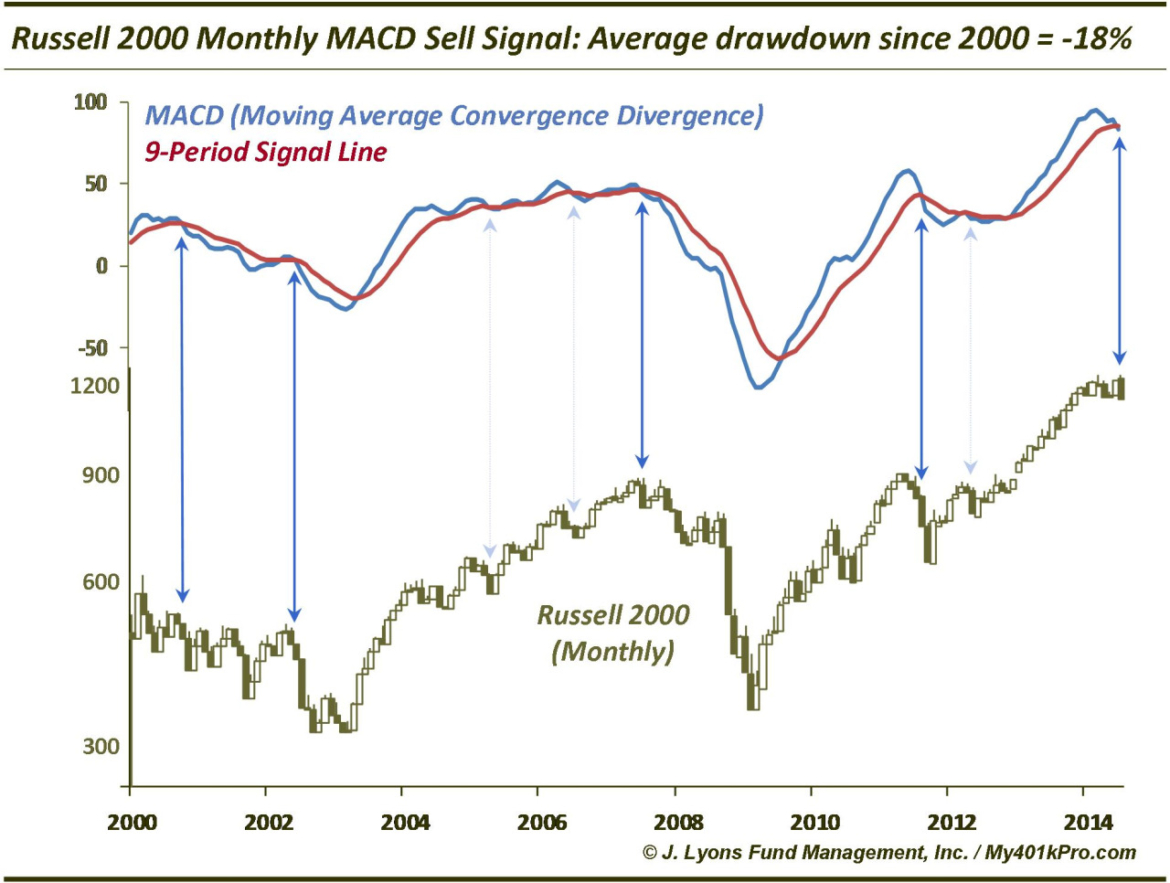
Where we do still find traditional technical analysis tools to be most helpful is on a longer-term basis. When one zooms out to the bigger picture, there are fewer “signals” generated. Thus, the signals take on added importance. One example of a TA tool that has continued to be useful as a longer-term indicator is the Moving Average Convergence Divergence, or MACD. Without getting into the details, it is essentially a sign of momentum. It is traditionally used with a moving average “signal” line that produces buy and sell signals when crossed. On a monthly basis, the MACD produced such a “sell signal” in July on the Russell 2000 Small Cap Index.
As shown in the chart, such signals are infrequent and therefore carry more significance. Since 2000, the MACD has only given a sell signal 7 times before this one, or just once every 2 years. It has paid to heed such warnings over that time. On average, the Russell 2000 suffered an 18% drawdown following those signals as measured by the loss from the monthly closing price at the time of the signal to the lowest point before the MACD gave a buy signal. An 18% loss would take the Russell 2000 down about 200 points from here.
Of course, of those 7 sell signals there were a few “false” signals, in fact 3 of them. The signals in 2005, 2006 and 2012 produced average drawdowns of just 3%. However, the other 4 sell signals produced an average drawdown of -30%.
Will this signal turn out to be a false alarm or the real deal? There is no way of knowing that beforehand, of course. Sure, there is plenty of drilling down into the data that can be done as well as tactics on a shorter-term time frame that can help one manage the signal while waiting for confirmation as either false or legitimate. However, taken at face value, every signal should be treated equally – as the real deal. As they say, the win or loss is not as important as the amount one gains or loses on a win or loss. And if this sell signal is the real deal, the losses could be substantial in small caps.


