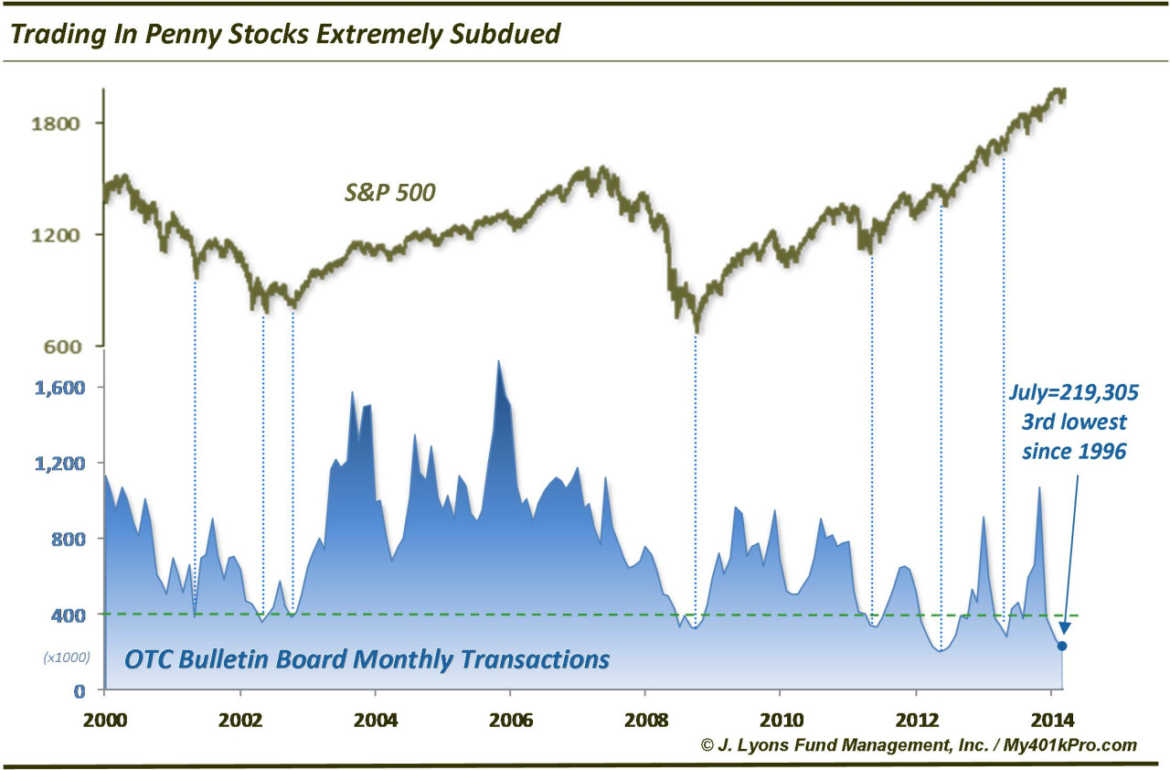
No Evidence of Froth In Penny Stocks
There is certainly no shortage of excessive behavior in the financial markets right now, from equity valuations, allocations and sentiment to corporate behavior pertaining to IPO’s, M&A, debt issuance, etc. One area, however, conspicuously absent from this excessive behavior is one that in many ways is the embodiment of speculative excess: penny stocks. Transactions in these stocks during the month of July totaled just 219,305, according to OTC Bulletin Board. This was the 3rd lowest figure since 1996, behind only two months in 2012. That is not the type of behavior one would expect at a cyclical market top.
For reference, in March of 2000, transactions in penny stocks totaled over 5 million. We did not include it on the chart as it distorts the scale. That is frothy, speculative behavior. The 2007 top did not experience that type of froth but penny stock activity was considerably higher than it is currently. The peak during that cycle occurred in March of 2006 at over 1.7 million transactions but for much of 2006 and 2007, monthly transactions remained over 1 million. That mark has only been reached during 1 month since, in March of this year. It would be tough to make the argument that penny stock activity reached an excessive level based on that one month, particularly since it has retreated to near 18-year lows now.
Incidentally, using transaction volume seems to more accurately reflect collective investor sentiment than share volume or dollar volume. At times, share and dollar volume has been distorted by heavy activity in one particular stock, like FNMA this past year.
There are plenty of red flags in this market. Penny stock activity is not one of them.


