V-Bottoms Part 2: The Aftermath-What To Expect
On Tuesday, we discussed the stock market’s new found propensity to form V-Bottoms over the past few years. Based on the criteria we laid out in the post, after averaging just 1 such bottom every 1.7 years from 1950 to 2012, the S&P 500 has registered 8 of them now in the past 18 months alone, including the move surrounding the August 7 low. So now that we’ve identified the pattern, what can we expect from the current iteration?
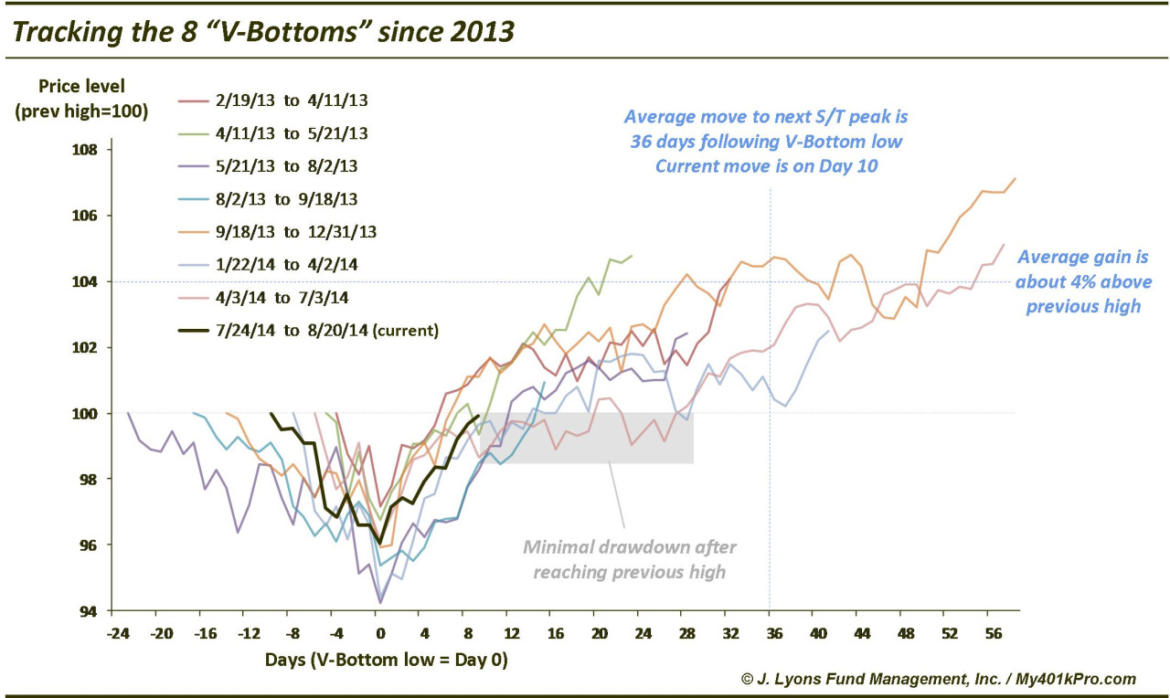
The Chart Of The Day tracks each of the V-Bottoms since 2013 from the high before the sell off to the subsequent short-term peak (which in each case preceded the next V-Bottom move). This can give us a little insight into how the current move might unfold.
One thing that is evident is that once the S&P 500 rallied all the way back to its previous high post-V-Bottom, there was very minimal giveback. The largest pullback after returning to its former high was only about 1% on a closing basis. Based on that, any sell off from here would be limited to a close around 1967 on the S&P 500. Therefore, anyone who is waiting for a pullback to buy (or cover shorts) best not wait very long before pulling the trigger. That said, a decline beyond that 1% threshold may be a head’s up that there is something different about the aftermath of this V-Bottom.
In terms of potential upside, the average gain following the V-Bottoms was around 4% above the previous high. Obviously, the individual cases run the gamut with gains as low as +1% (following the August 2013 low) and as large as +7% (following the October 2013 low). For reference, a 4% gain above the S&P 500’s prior high of 1987.98 would equate to 2067.50.
From a duration perspective, the average S&P 500 move lasted 36 days following the V-Bottom low until the next short-term peak was reached. That includes roughly 10 days to go from the low to the previous high. Therefore, after reaching the former high, the average rally lasted 26 days, or a little over a month. Yesterday was day 10 for the current move. Thus, another 26 days brings us to the end of September. Again, the moves varied from short (15 days following the August 2013 low) to long (58 days following the October 2013 low and 57 days following the April 2014 low).
It should go without saying that every market period is different. This event will not unfold exactly like any of the previous V-Bottoms in particular nor the average of them. It may however serve as a rough guideline of what we might expect after the most recent V-Bottom.
If the environment is indeed similar to what it has been over the past 18 months, we can likely expect moderate upside over the next few weeks to months with very little in the way of a pullback.


