SPY Volume Extremely Skewed On Down Days
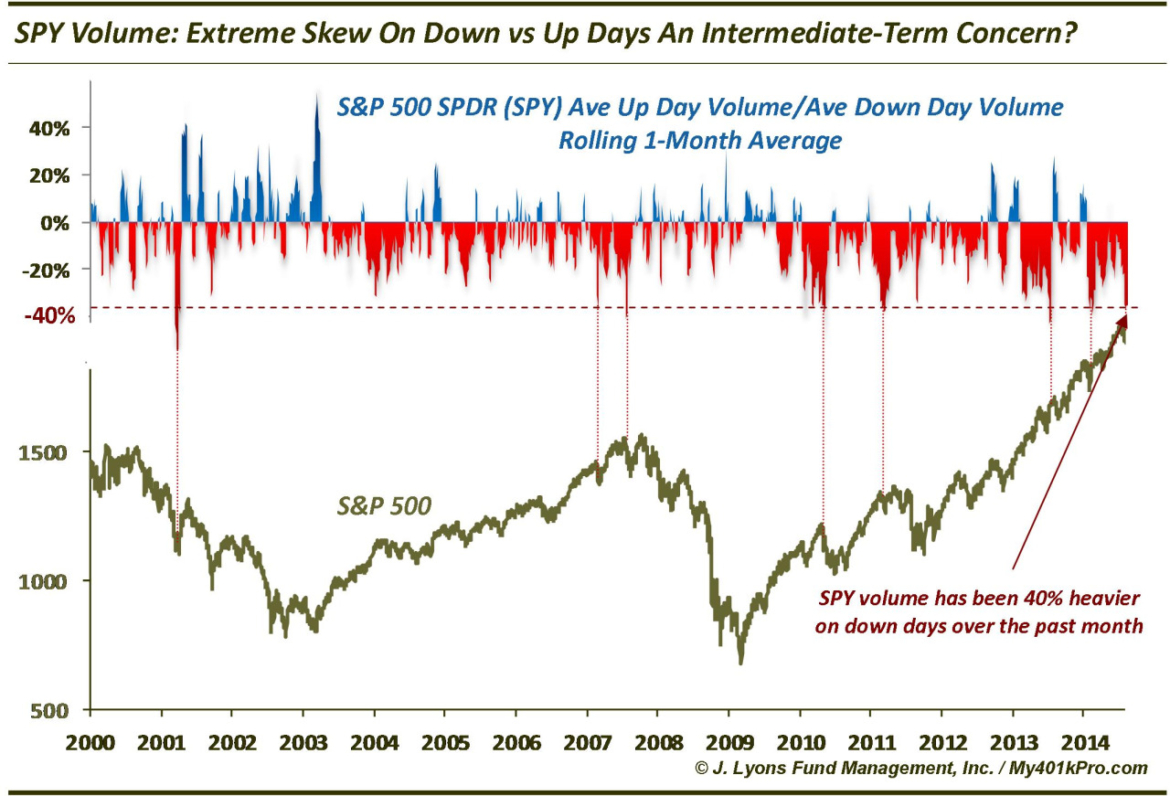
We don’t typically pay a whole lot of attention to volume unless we see some anomalous behavior going on. Well, considering this unique market environment, you probably wouldn’t be surprised to learn that we see evidence of that. As we have mentioned a few times here regarding the Nasdaq, volume as a whole has been much heavier on down days than up days over at least the past few months. This skew is particularly evident in the S&P 500 SPDR ETF (SPY), the subject of our Chart Of The Day, where the average volume over the past month has been a staggering 40% greater on down days than on up days.
Intuitively, one would think that such a skew is either a negative harbinger or a sign of a washed-out market. There is evidence that both those arguments are correct. A peak at history (at least since 2000), reveals only a handful of times when SPY volume was anywhere near this skewed on down days vs. up days. Those handful can be broken down into 3 regimes. The first regime from 2000 to 2006 saw just 1 occurrence, in March of 2001, at the culmination of a pretty relentless 7-month decline. The washout in volume led to a decent bounce over the next few months but more intermediate-term damage afterward.
The 2nd regime saw occurrences in March and July 2007, February and May 2010 and March 2011. These all occurred after the first bout of weakness following extended low-volatility rallies. This makes sense as a long, slow grind higher creates complacency but not necessarily a lot of volume along the way. After the first sniff of weakness, everybody tries to rush for the exits at the same time. It’s as if several months worth of light volume on the upside is forced into a relatively few bad down days.
The other similarity among the 2nd regime occurrences was that the weakness was not over after that initial bout of selling. Indeed, except for the May 2010 Flash Crash episode which preceded continued selling pressure for a few more months, each of the other examples saw an intermediate-term bounce before experiencing an even greater decline. It was as if the initial weakness that produced the down volume skew was a shot across the bow warning of a larger impending drop.
The 3rd regime consists of occurrences in July 2013 and February 2014 (and perhaps the present example). These episodes were similar to the 2nd regime ones in that they occurred following moderate weakness within a steady, low-volatility uptrend. The difference is, there was no second shot. The market simply resumed its grind higher. Will this be the way the trend continues? Not forever, no. But given the similar manner is which the market is behaving versus the past two examples (including the recent V-Bottom), we have no reason to expect it to change yet.
What is our takeaway? Our feeling is that the downside volume skew is an unhealthy condition. It likely is not a catalyst for something bad to happen. However, it can exacerbate a negative situation should one occur. In recent years, the market has been able to stave off any serious declines so this skew condition hasn’t resulted in too much pain. However, when the next big decline hits, the skew is likely to make things even worse as everyone rushes for the same exit at the same time.


