Current setup suggests further short-term stock market weakness
(Edited to add last paragraph and table)
With the S&P 500 futures ripping a slingshot 50-handle bounce straight up from the Thursday night lows, we hate to be the bearer of any potential buzz kill. However, the structure of market action during the reversal of the past few days suggests that we might not be off to the races again just yet.
Specifically, the S&P 500 made a 2-month low on Thursday on higher than average volume. After a Thursday night geopolitical scare sent futures sharply lower, the market reversed and closed higher on Friday by over 1% on well below average volume. While we do not pay a lot of heed to volume, in this case the market’s historical reaction to similar conditions has been very consistent. To wit:
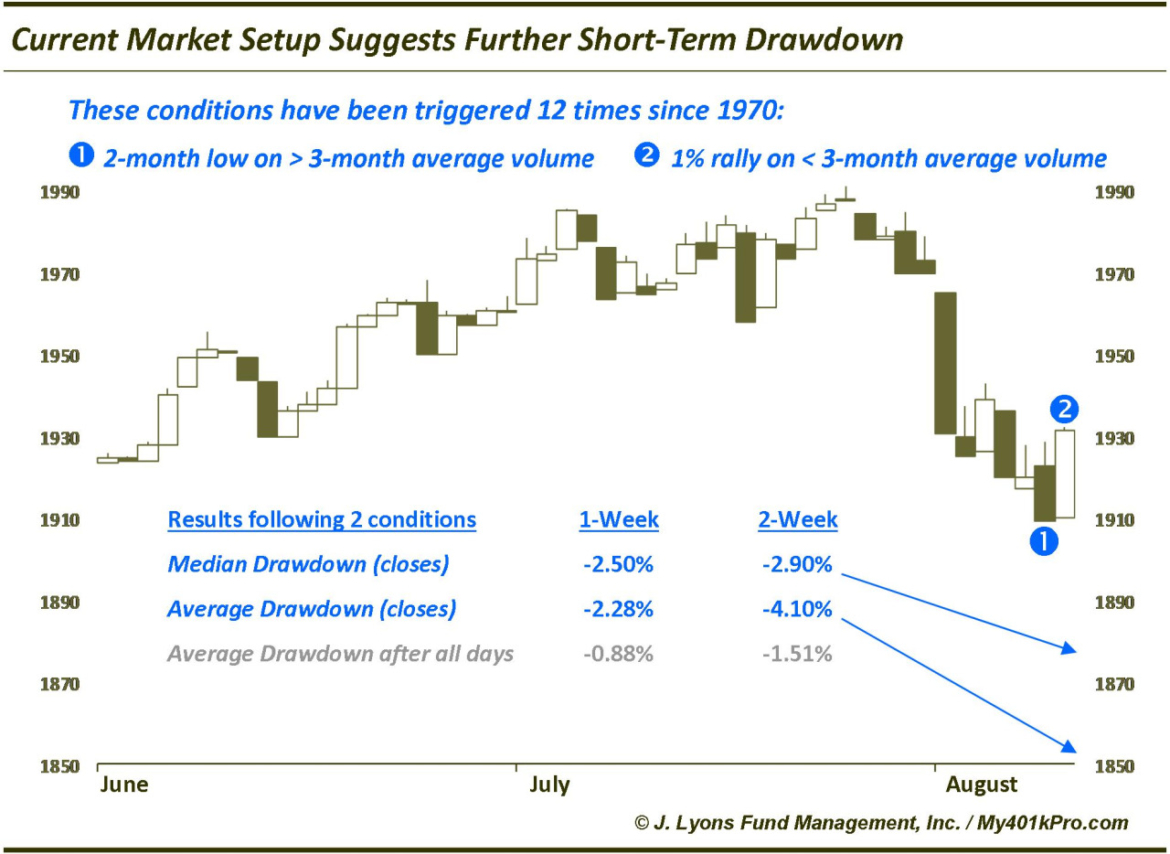
Since 1970, there have been 12 instances in which the following conditions apply:
- A 2-month low in the S&P 500 on higher than average 3-month volume (NYSE+Nasdaq combined volume).
- A rally of at least 1% the following day, on less than average volume.
In 11 of the 12 instances, the S&P 500 closed lower at some point over the following week, by an average of -2.28%, significantly worse than the average 1-week drawdown after all days of -0.88%. By 2 weeks, all 12 of the instances had closed lower at some point, by an average of -4.10%, versus the average of -1.51% after all days. This implies that, even if we are near a short-term bottom, the S&P 500 will still make at least 1 more lower low before the recent pullback has run its course.
Does the continued rally today (Monday) give any clue as to the validity of the historical precedents – or the extent to which subsequent drawdowns may reach. As it turns out, not really. Four of the precedents saw continued upside the day after the low-volume rally day. Drawdowns following those 4 included the smallest 1-week (0.0% on 5/21/2012) and the largest 2-week drawdown on 8/17/1998), so no real help there. Below are all 12 dates. Those with an asterisk denote that the market rallied the day after the low-volume reversal day (i.e., like it did today).
Date 1-Wk DD 2-Wk DD
10/9/1972* -2.8% -2.8%
9/25/1990 -2.4% -2.4%
8/17/1998* -0.2% -11.6%
5/28/1999 -0.6% -0.6%
2/26/2001 -2.6% -6.9%
3/19/2001 -4.5% -4.5%
6/17/2002 -4.5% -6.5%
3/12/2004 -1.4% -2.6%
11/23/2007 -2.3% -2.3%
2/1/2010* -3.0% -3.0%
5/21/2012* 0.0% -2.9%
1/30/2014 -2.9% -2.9%
Average of 12: -2.3% -4.1%
Average all days: -0.9% -1.5%


