CAPE Fear?: Using 5-year average earnings only slightly lowers valuations
There’s been a bit of a firestorm in recent days regarding CAPE, or Cyclically Adjusted Price to Earnings Ratio, at least in the amusing world of financial social media. It seems a bit silly that there would be such a squabble over a statistic since, well – it’s a statistic. As they say, statistics don’t lie, people do. While we’re not suggesting that folks are lying about the CAPE, it certainly appears that one’s general market view significantly colors their interpretation of the metric.
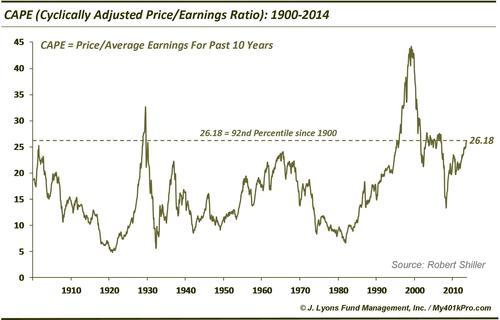
For those unfamiliar, CAPE is a measure of price to the average earnings over the past 10 years. It was developed by Yale Professor Robert Shiller and, for many, it is a preferred metric versus using simply the current earnings since it smooths out major, temporary dislocations that can skew the ratio. This is a reasonable exercise as, for example, the financial crisis all but erased earnings for a brief period and greatly distorted price/earnings ratios at the time. The issue at the core of the recent firestorm is whether or not CAPE is currently expensive and/or a negative influence on the market at the moment. Based on historical precedence, the conclusions are pretty straightforward:
- CAPE is unquestionably expensive now, and
- It is not an immediate death knell for the market.
At a current level of 26.18, CAPE is currently in the 92nd percentile of all monthly readings since 1900.
Regarding point #2 above, the market has not necessarily rolled over immediately upon attaining such lofty valuations (although it did in 1929). In the late 1990’s, the market continued higher for several years culminating in the all-time high CAPE reading (and every other valuation metric) at the height of the dotcom bubble in 2000. The median 1-year return following similar CAPE reading (between the 90th and 94th percentile) is actually +6.8%, not far off of the +8.4% for all years. However, when looking out 5 years we see that this is not the ideal time to invest. The median 5-year return following readings at this level is -6.6% (-1.3% annualized).
One of the arguments that current CAPE readings be dismissed, or at least asterisked, is that by using 10-year average earnings, the nearly nil earnings at the height of the financial crisis are included in the metric. Obviously, that has the effect of raising the CAPE reading. That is a reasonable argument, and one that is easily remedied: use a different CAPE. That is, use a different duration than 10 years to average earnings. There is no law that says 10 has to be the look back period. Like so many financial and market measures, it has simply become the accepted period since Mr. Shiller proposed it. We have no problem with it but we have no problem revising it either for the sake of this discussion or analysis in general.
So without data-mining, let’s pick 5 years in which to average earnings. We are picking 5 for a few reasons: A) it is half of 10, B) it is a common standard and most importantly C) it removes the worst of the earnings readings from the 1st half of 2009 from the measurement. Here’s how a 5-year CAPE ratio looks since 1900.
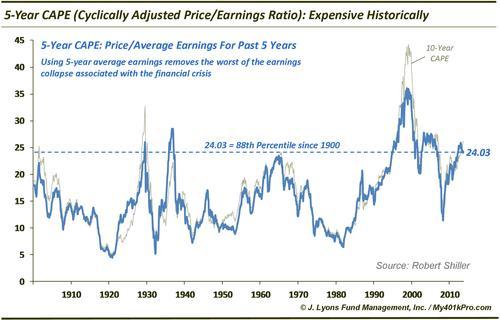
At 24.03, the 5-year CAPE is slightly lower than the 10-year CAPE on an absolute basis and on a percentile basis. Historically, it rings in at the 88th percentile. So, perhaps valuations are a little less rich than those implied by the standard CAPE measure. Unfortunately, the forward returns are still not much to speak of.
The median 1-year return in the S&P 500 following similar readings (between the 85th and 89th percentile) is in line with the overall average at +7.4%. However, the median 5-year return is just +0.5% (0.1% annualized).
So what can we conclude? First, CAPE valuations are very expensive (92nd percentile) by historical measures. By shortening the CAPE’s look back period on earnings to just 5 years, we remove the worst portion of the earnings from the financial crisis. This only slightly reduces the measure of valuation, however, as the 5-year CAPE is still at the 88th percentile, historically. Both readings do not necessarrily spell the end of the cyclical bull market as the 1-year returns following such years have more or less been in line with the average. However, on a longer-term basis, periods coinciding with such valuations have historically not been a good time to invest.
Something tells me we aren’t going to change a whole lot of minds on either side of the CAPE fence.


