Volume Is Low…Even For August
It’s no secret that stock exchange volume has been declining for some time. It’s also no secret that volume in August, particularly towards the end of the month, is typically low. However, if it seems like volume has been especially low this month, you’re not imagining things. As our Chart Of The Day reveals, volume this month has been especially low relative to the year-to-date monthly average.
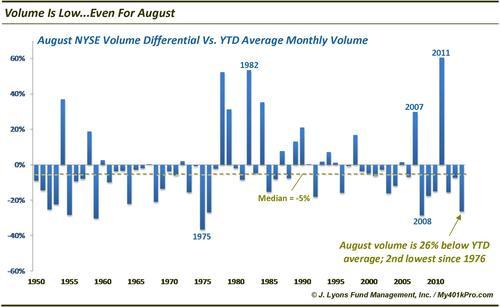
Since 1950, the median differential between August NYSE volume and the YTD average monthly volume has been -5%, i.e., the median August sees 5% less volume than the monthly average from January to July. This month’s volume is tracking well below even that.
While relatively low August volume is the norm (since 1920, volume during the month has trailed the YTD average 72% of the time), it is not always the case. However, it has very often taken a key event to drive August volume above average. A testament to that fact is that when volume is above average in August, it is well above average. Of the 27 times since 1920 that August volume has been above average, it has been so by an average of 20%. Some of the key events which produced such heavy volume were initial market tops preceding the crashes in 1929 and 1987, early stages of a cyclical rally in 1932, early stages of the secular bull markets in 1949 and 1982, the Iraqi invasion of Kuwait in 1990 and the debt ceiling/downgrade issues in 2011.
Is this simply a trivial exercise or is there a practical application in this data? It’s likely mostly the former…but perhaps there is something of value as well. In examining the data, the Augusts that showed the lowest relative volume had lower average returns going forward — much lower. Conversely, the Augusts with much higher than average volume saw very positive returns.
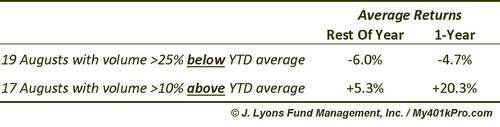
Interestingly, the two groups in the table each averaged 6-7% year-to-date returns through August (as measured by the S&P 500). However, following the Augusts with well below average volume, the S&P 500 lost an average of 6% through the end of the year while the years with well above volume saw average gains of +5.3% through December. It was a similar story through 1 year as well. We will note that several of the well below average August volume years came during the secular bear market in the 1930-40’s. However, the top two above average volume Augusts (1932 and 1935) did as well.
How much stock do we put into these statistics? Truthfully, not much. It will be interesting to track nonetheless to see if the poor returns again follow this below average volume August. If nothing else, we found a study to kill time as the market continues its low-volume dog-days drift.


