The Most Important Trendline In Equity Land: New Highs-New Lows
The problem with trendlines is that they are usually subjective. Rarely are they cut-and-dry. And even when they are obvious, it has become more commonplace recently that breaks of trendlines, up or down, have been false moves. That’s not too surprising given the tremendous increase in traders and investors adopting technical analysis as well as widespread access to such resources. The more attention that is focused on a particular type of analysis, the harder it is to exploit such analysis. Thus, the exploiters become the exploitees. Whether it’s the algo-bots or simply the collective market forces that forbid the consensus of participants from profiting from “obvious” signals, trendline breaks are now very often fakeouts. As often as not, it seems, prices revert back to the primary trend in short order causing traders to…draw a new trendline. Thus, the subjectivity.
Therefore, our pick for the most important trendline to watch in the world of equities is not an equity, or equity index, at all. It is an indicator. Whereas equity trendlines are prone to false breaks of late, indicators often conform to truer, more reliable trendlines. But why would an indicator trendline be the most important? Considering this market environment is one characterized by divergences and weakening internals – perhaps moreso than any time since the 1998-2000 period – a focus on that dynamic seems more than appropriate.
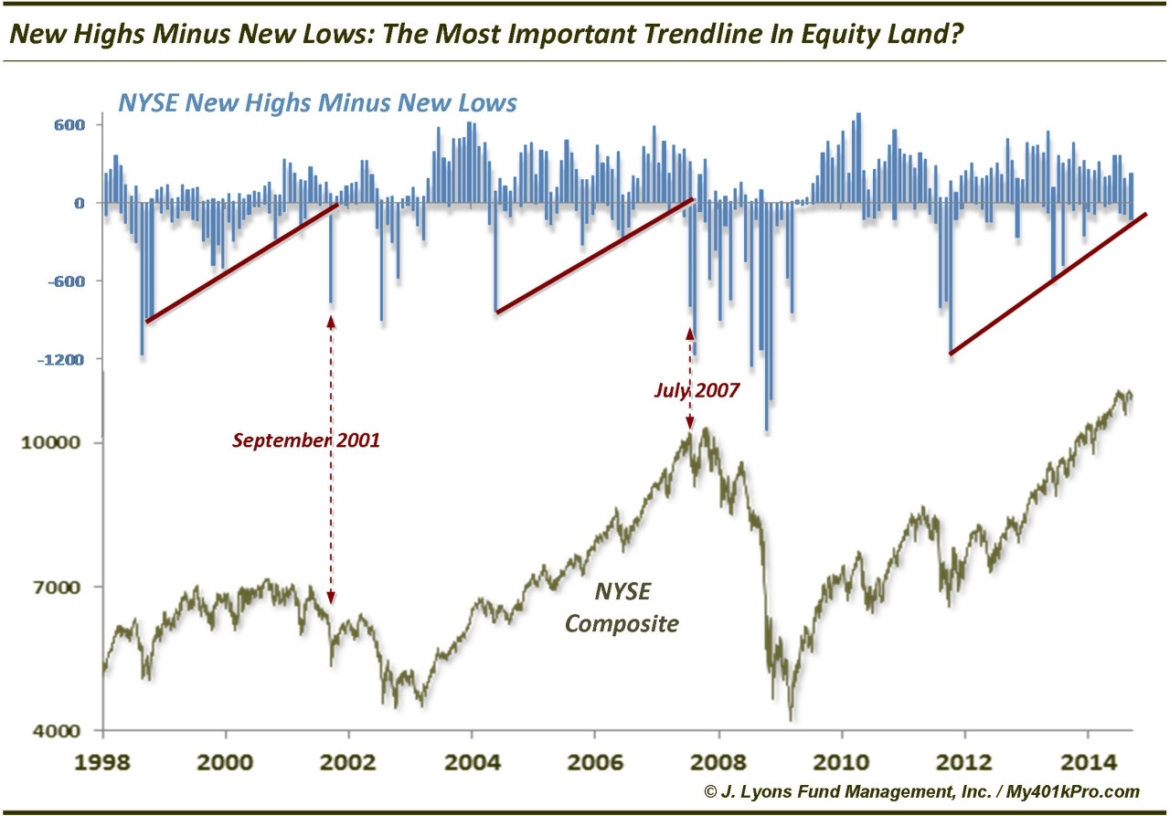
The indicator we have selected for this distinction is the number of New 52-Week Highs minus New 52-Week Lows on the NYSE. We’ve discussed the weakening trend of New Highs several times over the past few months, including on September 10, September 2, July 25 and May 1. The reason we chose this particular indicator is due to A) the cleanliness of the trendline and B) the degree to which it has been helpful in the past.
As we have cautioned ad nauseam, the difficulty with divergences is the unpredictability in timing their impact. They can persist for a long time without serious consequences. One way to combat that unpredictability is by using a trendline, or similiar method, to detect when the indicator breaks down (or out). This can signify a point of impact.
For example, New Highs have been declining for some time so we need a way of determining when that trend will matter. Since they do not have much room to break down, as they are bound by zero, we use the spread between New Highs and New Lows. Looking at this indicator, we can see clear, distinct uptrends from cyclical lows to cyclical tops (by the way, we could use simply New Lows but we like the added information of having both series in the indicator).
This analysis was very helpful in identifying major turns in the past two cycles. On the chart, you can see that New Highs-New Lows made a series of higher lows from 1998 to 2000. During the sell off in September 2001, the indicator broke the uptrend, spiking lower. This was a head’s up that the major trend was broken. FYI, yes the large cap indexes clearly topped in 2000 and had already suffered major damage by September 2001; however, many small and mid caps held up fairly well in 2000 and early 2001 (of course, many of them suffered bear markets from 1998 to 2000). It wasn’t until until 2001 than many of them broke trend and began their descent into the real carnage of 2002.
Likewise, from 2004 to 2007, New Highs-New Lows formed a similar uptrend. The trendline break was a more timely one this time, occurring in July 2007, just off the top. It was again a head’s up that more serious damage was to come than the mild corrections of the years prior.
Currently, we see the same condition. While the NYSE New Highs have been steadily declining, the uptrend in New Highs-New Lows is still in force, stretching back to 2011 (and 2009 as well, but we like to start the trend over after the indicator breaks out to the upside like it did in 2010.)
It has paid and will likely continue to pay to avoid becoming too bearish from a longer, cyclical-term perspective until this uptrend line breaks. It will likely do so into a “warning shot” sell off as in 2001 and 2007. That is, it will occur into a sharp pullback that, while perhaps too late to warn of that concurrent weakness, will provide a warning that the longer-term picture has changed, for the worse.
** FYI, despite the recent rise in New Lows, it does not appear as if the New High-New Low uptrend line will be threatened today, as the statistics currently stand.
________
More from Dana Lyons, JLFMI and My401kPro.


