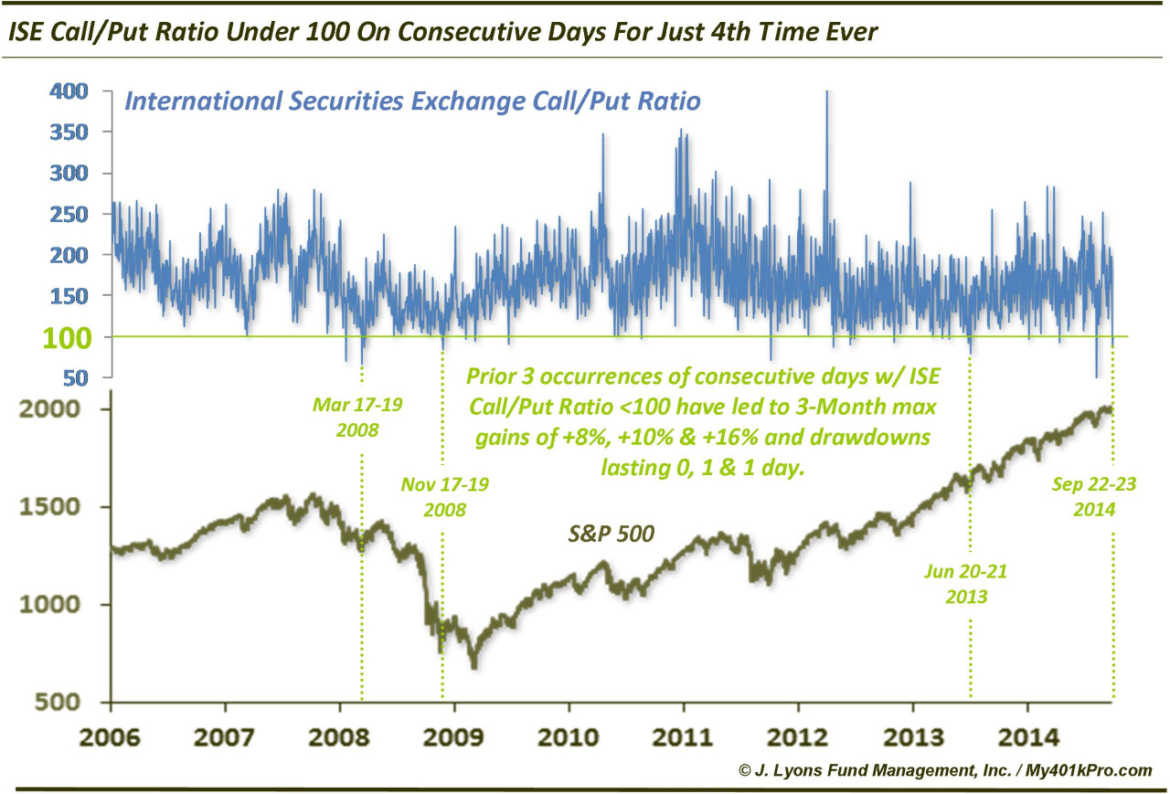
Rare Display Of Caution From Options Traders
We have mentioned the International Securities Exchange Equity Call/Put Ratio a few times in this space (unlike most exchanges, the ISE presents its ratio with Call volume as the numerator instead of the denominator). The last time we mentioned it was on August 4 when we noted that, despite just a 6-day, 3% decline off of the highs at the time, the ISEE Call/Put Ratio registered its lowest reading in its history (since 2006) on August 1. While there were indications that the reading may have been somewhat skewed by a fat-finger trade, the reading – from a contrary basis – did prove somewhat prescient as the market bottomed 4 days later, within 1% of the August 1 close.
Today’s Chart Of The Day looks at the ISEE Call/Put Ratio again, in a similar light. On each of the past 2 days, the ratio closed under 100 for just the 4th time in history. This, despite the S&P 500 being just 3 days removed from its all-time high. We hesitate to put a lot of stock in a study with just 3 prior data points. Additionally, with the S&P 500 down a mere 1.5% from its high, our skeptical antennae is raised questioning whether this is a true indicator of investor caution. With that said, the prior 3 occurrences of consecutive readings under 100 have produced some remarkably positive results over the intermediate-term.
- March 17-19 2008 The S&P 500 formed an intermediate-term low on March 17. It rallied as much as 10% over the next 6 weeks and didn’t close lower for 3 months.
- November 17-19 2008 The S&P 500 dropped over 6% the following day, forming an intermediate-term low. Over the next 6 weeks, it gained as much as 16% above the 19th close and never closed lower over the following 3 months.
- June 20-21 2013 The S&P 500 dropped over 1% the following day, forming an intermediate-term low. Over the following 6 weeks, it gained as much as 8% above the 21st close and has not closed lower since.
Clearly the stock market performance following these consecutive days with ISEE Call/Put Ratios under 100 have been exceptionally positive, especially as measured by the risk to reward ratio. That said, we will reiterate that we would not get too giddy on the bullish side considering A) there are only 3 precedents and B) we are only 3 days removed from the all-time high. However, taken at face value this development is a positive one.
(Edited 12/15 to correct the ratio as the ISE “Equity” C/P Ratio, ISEE, as opposed to the complete ISE C/P Ratio.)
_________
More from Dana Lyons, JLFMI and My401kPro.


