V-Bottom Update: Current Cycle Still Following The Template
On August 19, we noted that given the recent action in the stock market, “V-Bottoms” were still in fashion. By that we meant the recent propensity for the market to rebound sharply from a short-term sell off and immediately bounce to previous highs. Based on the criteria we laid out in that post, the S&P 500 had just achieved the 8th V-Bottom since the beginning of 2013 – this, after forming just 38 such bottoms in the prior 62 years, or 1 every 1.7 years.
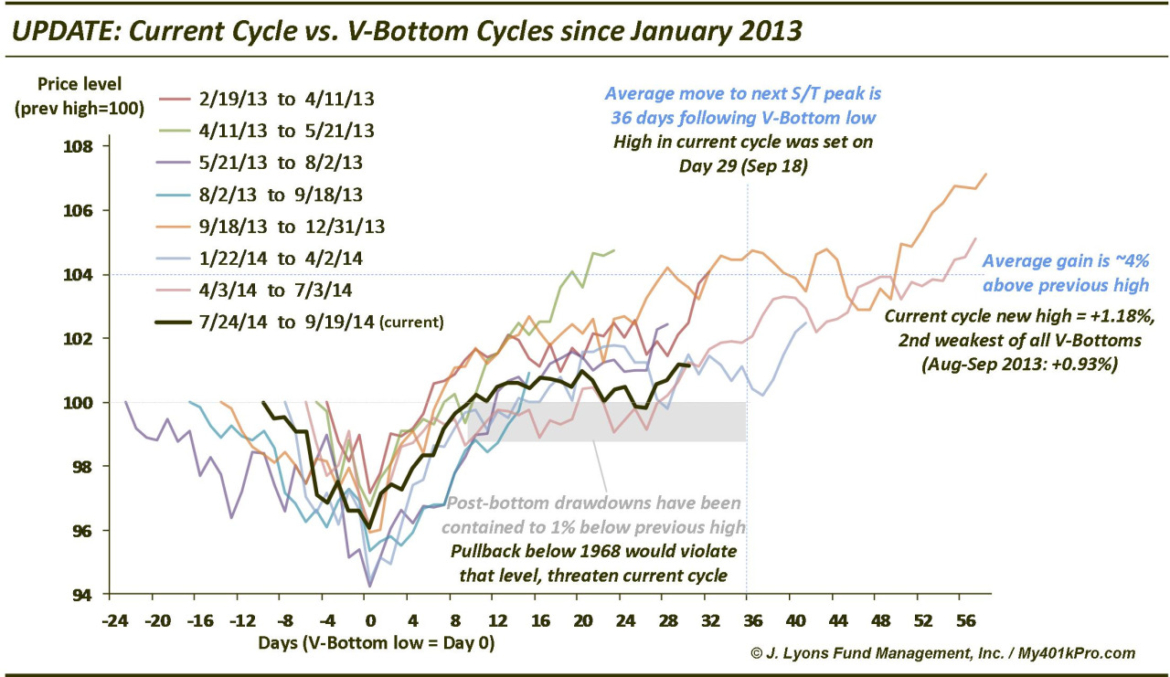
Our August 21 Chart Of The Day looked at the 7 V-Bottoms since 2013 to get an idea of what we might expect from the current iteration. The general tendency following the V-Bottoms was for the market to grind its way higher for another month or two, with very little in the way of drawdowns along the way. The current cycle has tracked that template over the past month since the post.
Since hitting a new high on August 21, the S&P 500 has generally moved sideways, with a slight upward bias, i.e., a grind higher. The high for the S&P 500 was set last Thursday, September 18. That marked the 29th day since the V-Bottom low. The average duration from the low to subsequent short-term high following the 7 prior V-Bottoms was 36 days, so the S&P 500 is near that benchmark. That said, the duration of the post V-Bottom rallies has varied widely. Of the 4 cycles that went further than the current one, 2 of them lasted 57 and 58 days respectively. In the present cycle, that would equate to another 5 weeks beyond today. So there is precedence for the move to persist for awhile longer.
In terms of magnitude of gain, the high on September 18 was 1.18% above the prior cycle high. That is the 2nd weakest post V-Bottom rally of the past 2 years. Interestingly, the only cycle that saw a shallower new high, at just 0.93%, occurred during the same seasonal period last year, from August to September. Perhaps that is coincidence, perhaps not.
What would be a tell that the current cycle has topped? Based on the previous 7 cycles, we see that drawdowns have been extremely limited following the move to a new high. The worst was a mere 1% below the previous cycle closing high. The high of the prior cycle was 1987.98 on July 24. Should the S&P 500 drop below about 1968, representing an approximate 1% drop below the prior high, it may be a head’s up that this V-Bottom cycle has run its course.
Based on alternate analysis, we see key support on the S&P 500 at 1970-1975 so that would support the notion of the 1968 level as relevant.
Of course, the S&P 500 could break that level and proceed to form yet another V-Bottom and head back up again. We will address that possibility should it arrive. For now, the S&P 500 continues to follow the V-Bottom template laid out by the previous 7 occurrences. While we have plenty of concerns about this market (other broad indexes are not following this pattern), as long as price continues to conform to the template, we will assume the present V-Bottom cycle is still in force.
_________
More from Dana Lyons, JLFMI and My401kPro.


