Equal Weight S&P 500 Starting To Lag – Shades of 2007?
Another divergence post? Yes, sorry, we know it is getting mundane. However, we post what we see and there is an abundance of divergences present in today’s market. Eventually, they will likely succumb to a negative resolution. However, as we have stated many times, the problems with relying on divergences are that A) they can last for a considerable amount of time and B) they may ultimately resolve positively, i.e., the lagging component catches up to the leading component, dissolving the divergence.
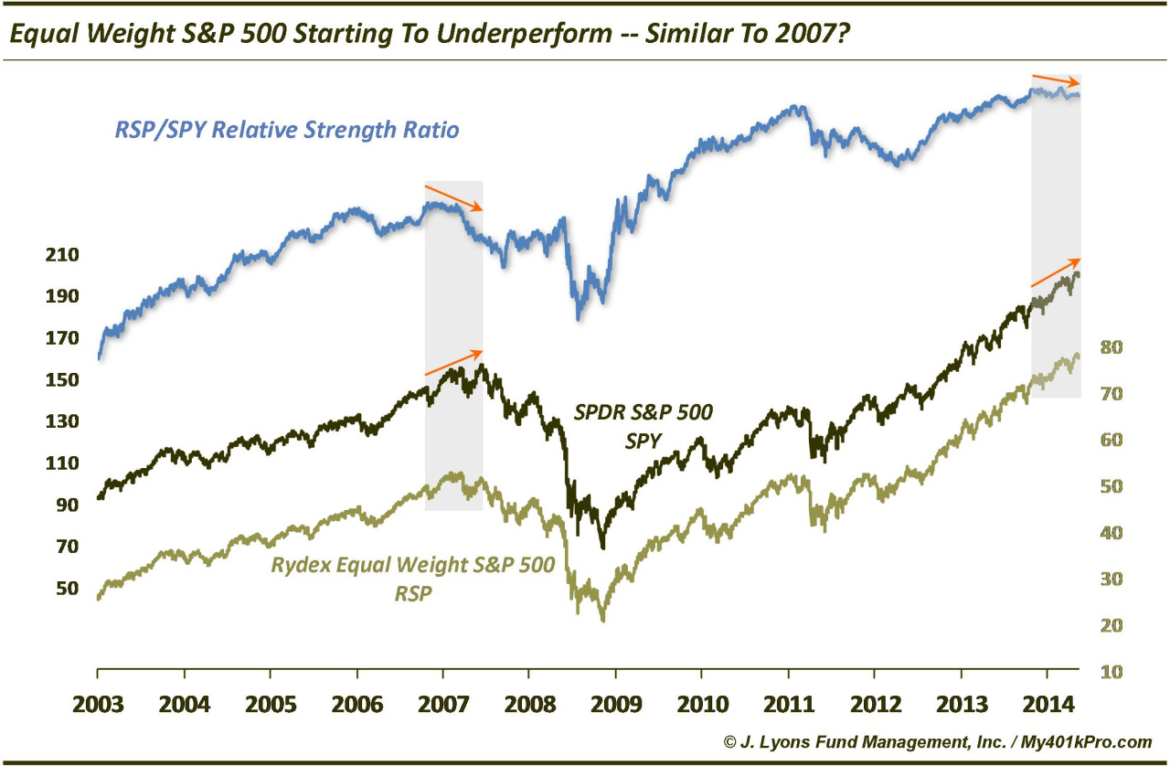
Today’s divergence du jour/Chart Of The Day deals with the ratio of the Rydex Equal Weight S&P 500 ETF (RSP) to the SPDR S&P 500 ETF (SPY). SPY is a typical cap-weighted ETF, like the index itself, in which weighting is based on each stock’s market cap. The bigger the cap, the larger the weighting. RSP weights each component equally and, thus, its performance is a good barometer of the level of participation among all stocks.
As we have discussed often, it is preferable to have as many stocks as possible performing well. The more stocks participating in a rally, the healthier it is. Therefore, when RSP is doing relatively well, the market is on healthy footing. Indeed, in the chart, one can see that during rallies, the relative performance of RSP to SPY has usually sloped upward. Once the ratio turned lower (i.e., lower highs and lows), the overall market suffered.
In 2007, the ratio flashed essentially its only divergence in its more than 10-year existence. It topped out in February of that year and made lower highs as SPY made higher highs in July and October. Obviously, in hindsight, the divergence was a good early warning sign of trouble to come.
In recent months, the ratio has begun to diverge again. It topped initially in February then made a slight higher high in June. However, it has essentially been moving sideways for the past 7 months, even as the market has made higher highs. During the market’s recent move to new highs, the RSP/SPY ratio made a noticeable lower high. This divergence could continue for some time and it could eventually be resolved positively with the ratio moving to a new high. For the time being, however, it is yet another divergence “red flag”.
(Note: In late 2006 and from 2011-2012, the ratio displayed temporary divergences as the market was either emerging from a correction or trending sideways. Once the market moved to a higher high, the ratio did in fact “catch up” to a new high as well.)
Given the number and persistence of many current divergences, we likely will not post on too many more of them unless the divergences are particularly egregious. That said, a steadfast climb – like the market we are now witnessing – that refuses to pay any heed to normally relevant warnings can numb investors to such things. That can be a dangerous condition if investors begin to shun all risk warnings whatsoever. That is when potential risk will likely manifest itself. As Verbal Kint put it in Usual Suspects, “The greatest trick the devil ever pulled was convincing the world he didn’t exist”.
Therefore, while we will try not to get caught up in overplaying some of these traditionally cautionary divergences – like the underperformance of the Equal Weight S&P 500 – we will also steel ourselves against dismissing them outright.
_______
More from Dana Lyons, JLFMI and My401kPro.


